

Utilising Refinitiv Lipper data to analyse the performance and flows of all ESG asset classes over the past 12 months.
- Performance: Top-selling “Green” Equity Global outperforms “brown” over three and five years, reversing over one. However, the opposite is true for Equity Global Income.
- Asset Class: All ESG asset classes, money markets excepted, saw net inflows over H122 of £16.6bn.
- Classification: Equity Global once again tops the ESG table, taking £10.8bn, at a slower flow rate than for Q1.
For more data-driven insights in your Inbox, subscribe to the Refinitiv Perspectives weekly newsletter.
ESG asset class overview
Negative performance across most markets is translating into negative sentiment, with net redemptions in long-term assets running to £49.9bn for the first six months of the year – £15.6bn of that coming out of equity funds.
However, ESG flows look resilient so far, with net flows for long-term assets employing such strategies standing at £16.6bn – £11.3bn of that to ESG equity funds.
Chart 1: Asset class flows, ESG versus Conventional, H1 2022 (£bn)
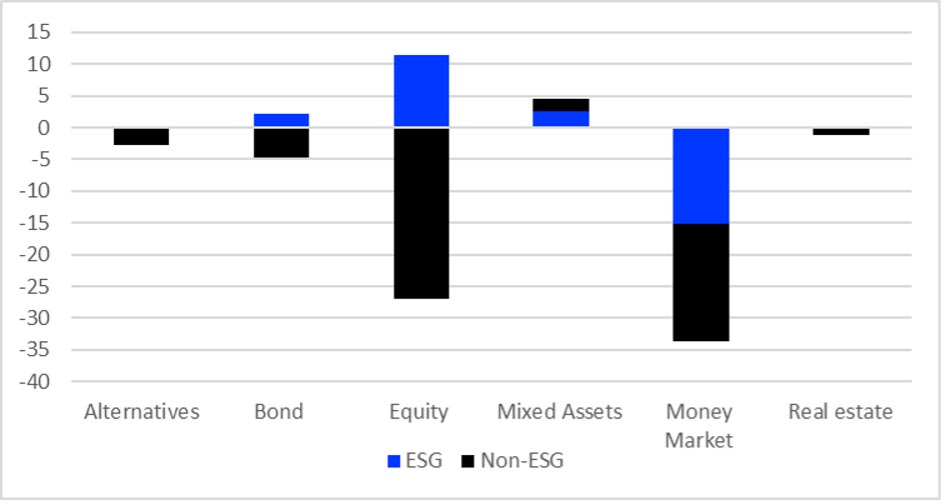
ESG alternatives, bond, and real estate funds saw inflows while their conventional peers experienced redemptions. Both classes of money market funds were in the red (-£15.3bn and -£18.5bn, respectively) and both mixed-assets categories were in the black (£2.7bn and £1.8bn).
Mixed assets stand out as being the only asset class with ESG flows being greater than their non-ESG equivalents.
It’s a similar picture over the second quarter and 12-month view (to end-June), with all long-term ESG asset classes in the black, although non-ESG mixed assets funds have only dipped into negative territory (-£409m) over the past quarter.
Chart 2: Largest positive ESG flows by Refinitiv Lipper Global Classification, H1 2022 (£bn): Versus conventional equivalents

At the more granular level of Lipper’s global classification categories, Equity Global ESG once again tops the table, taking £10.8bn over the first half of the year. That said, there’s been a slowing of inflows in the second quarter, with the classification adding just £3.2bn to its first-quarter take of £7.6bn.
Outflows for Equity Global non-ESG are broadly similar over both quarters, at about £3.5bn.
However, Equity Global Income now makes an appearance, with £933m of inflows (£723m outflows for non-ESG), indicating investors have taken more of a value tilt to their global equity allocations. That’s been a pretty good option for those who’ve taken it, as we’ll see when we look at performance, below.
Bond Global Corporate USD took £812m, with its non-ESG peers seeing inflows of slightly less. Dollar-denominated assets are likely to be attractive in this environment, both for the greenback’s safe-haven status and for the higher yield potential for such assets.
Local-currency global emerging market debt, where central banks are seen to have moved earlier than the Fed, are proving attractive (£544m ESG and £276m non-ESG) as opposed to their hard-currency peers – vulnerable to Fed rises – which have seen half-year outflows of £59m and £142m for ESG and non-ESG funds, respectively.
Inflation-linked GBP ESG bond funds took £507m (with £98m outflows for their non-ESG equivalents). And while Bond GBP Short Term ESG funds saw inflows of £403m, their non-ESG peers were down £2.8bn.
That’s an increasing rate of both allocation to ESG funds and redemptions from non-ESG funds during the first quarter, where the figures for short-term GBP were £31m and negative £799m, respectively.
Mixed Asset GBP Balanced and Aggressive ESG funds took £1.3bn and £1.1bn, respectively, with their non-ESG peers also enjoying net gains.
As we’ve argued elsewhere, this looks like retail investors deploying savings squirrelled away over COVID-19 and, as such, may trail off as social life normalises, but with the prospect of economic conditions worsening.
Lipper: The global leader in independent fund performance data
The ESG premium anomaly
Chart 3: ESG top-selling classification performance versus Conventional equivalents, H1 2022 (Percentage growth)
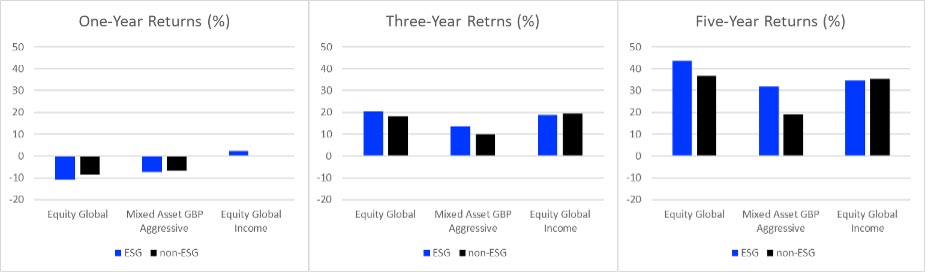
Chart 3 takes three top-selling sectors over H122 and compares the ESG and non-ESG performance within these classifications over one, three, and five years.
We’ve taken Equity Global as the top-selling classification for the period. We’ve skipped over second-placed Mixed Asset GBP Balanced, as its Aggressive sibling demonstrates the same pattern but with greater amplitude, and have alighted instead on Equity Global Income, as it makes for a thought-provoking contrast to Equity Global.
ESG flows have been resilient despite the erosion of the performance premium since markets rebounded in the autumn of 2020.
A prime example of this is the top-selling Equity Global classification, where the lead of ESG funds over three and five years has been reversed over one, and is consequently narrowing over the longer term.
However, that’s far from a universal phenomenon. With Equity Global Income, the situation is reversed, with non-ESG funds outperforming their ESG peers over three and five years but lagging over one.
The contrast between Equity Global and its Income sibling is instructive because it shows there’s something more going on here than just a change in style leadership, as growthy-Global gets overtaken over 12 months by value-biased Income.
That would be potentially sufficient to explain the outperformance of Equity Global Income over Equity Global over 12 months; it could also explain the outperformance of non-ESG over ESG within Equity Global over this period – but what it doesn’t help with is the outperformance of ESG Equity Global Income over Equity Global.
Figuring out what’s driving this is something that will take a little more digging at the portfolio level, and something that we will return to in due course.