Wadsworth Sykes looks at rising fuel prices in the U.S., and the subsequent impact on the Strategic Petroleum Reserve (SPR) throughout 2022.
- President Biden announced the release of 15 million more barrels of oil from the Strategic Petroleum Reserve on 18 October.
- As energy security is foremost in the minds of many, we used Datastream to examine some typical measures pertaining to U.S. reserves.
- Although security concerns have changed since the SPR was created in a response to the Arab oil embargo of 1973-74, it remains an essential security measure for the U.S. and the International Energy Agency.
For more data-driven insights in your Inbox, subscribe to the Refinitiv Perspectives weekly newsletter.
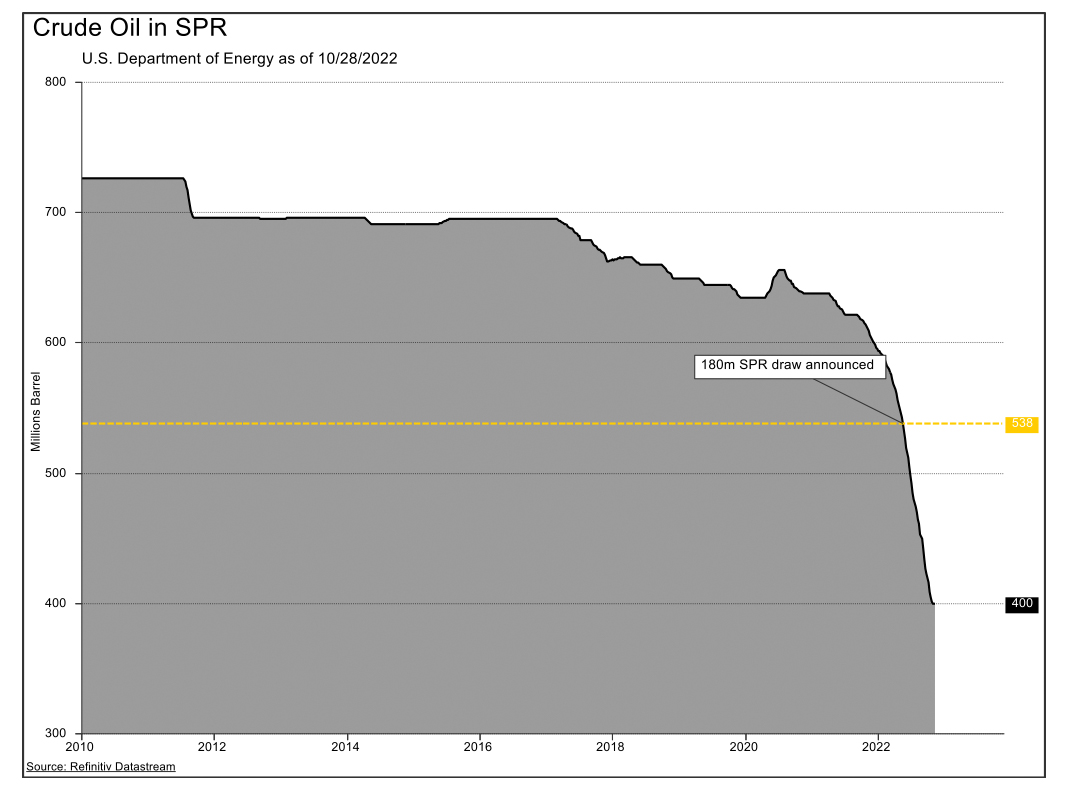
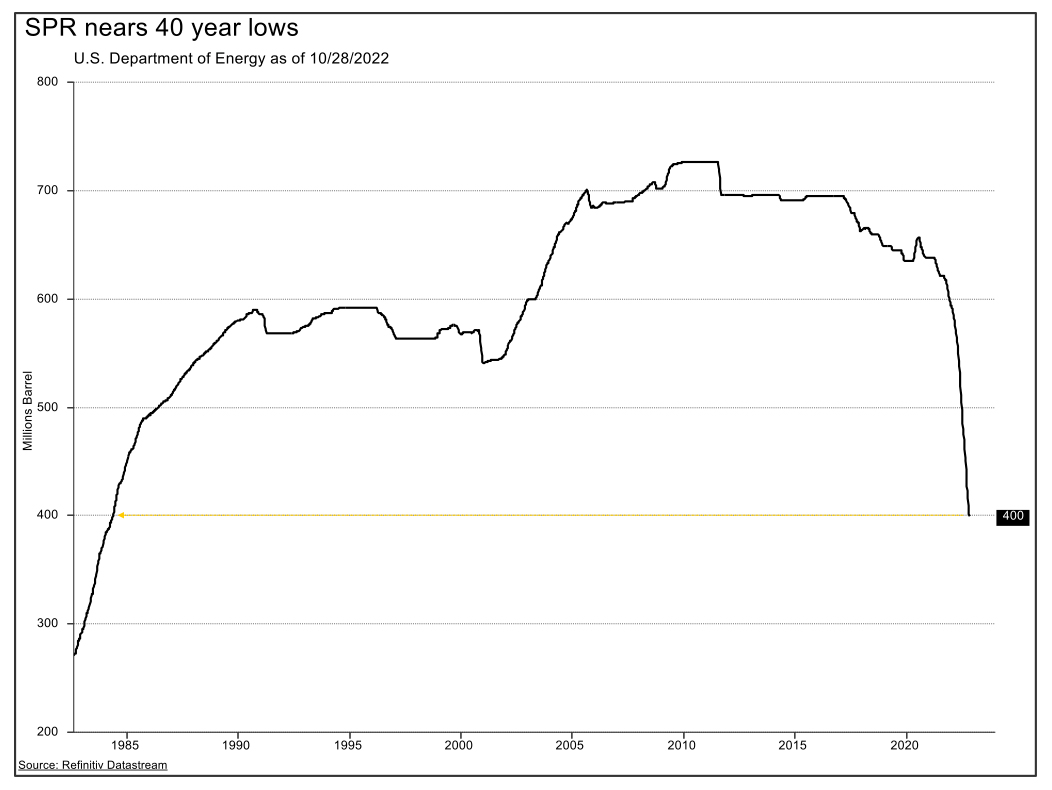
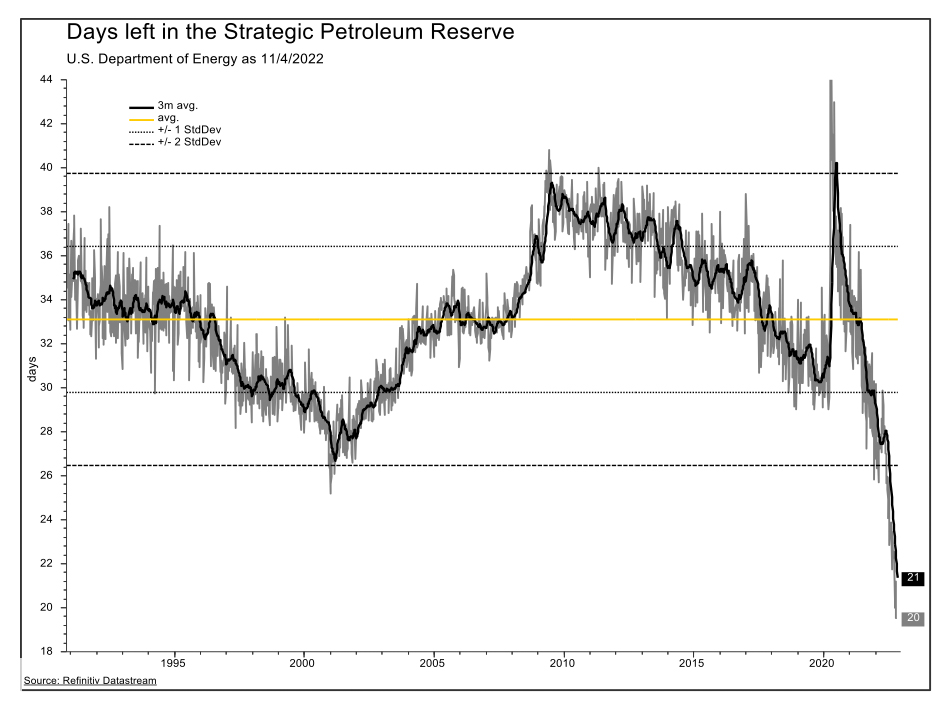
Strategic Petroleum Reserve stock levels
To combat rising fuel prices an announcement was made in spring 2022 to allow the drawdown of ~180m barrels of oil from the Strategic Petroleum Reserve by the end of October. The SPR has since reached levels not seen since the initial build up of the reserve 38 years ago.
How long would the SPR last at current levels?
Calculated by dividing the number of barrels in the SPR by the daily consumption provides a rough estimate for the number of days the Strategic Petroleum Reserve would be able to sustain domestic demand.
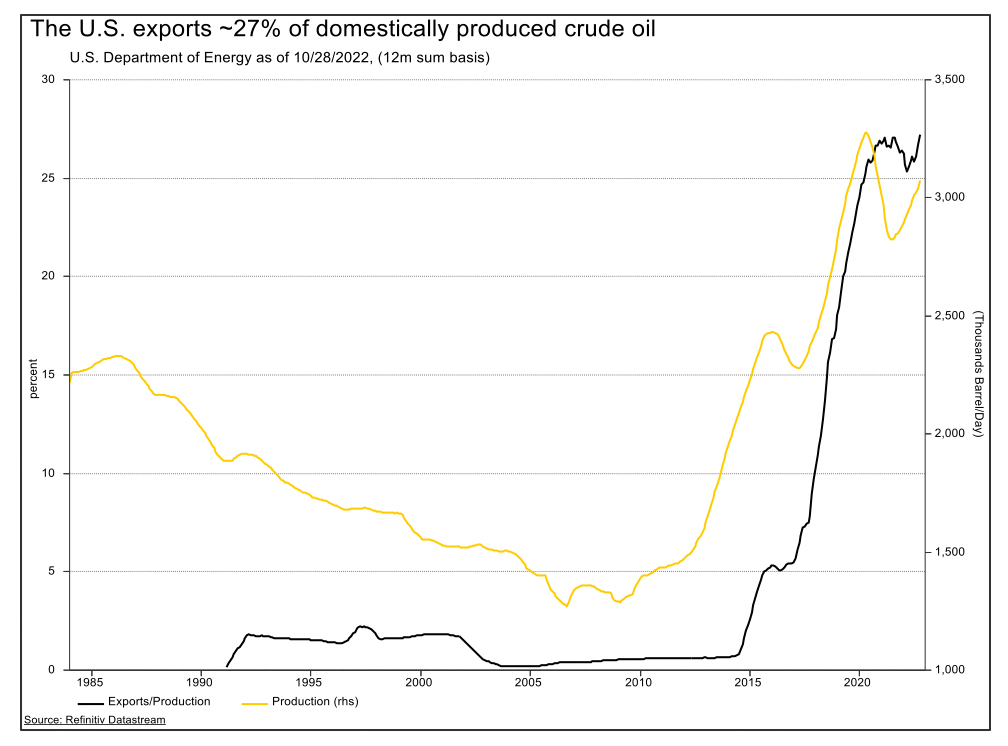
Production and exports
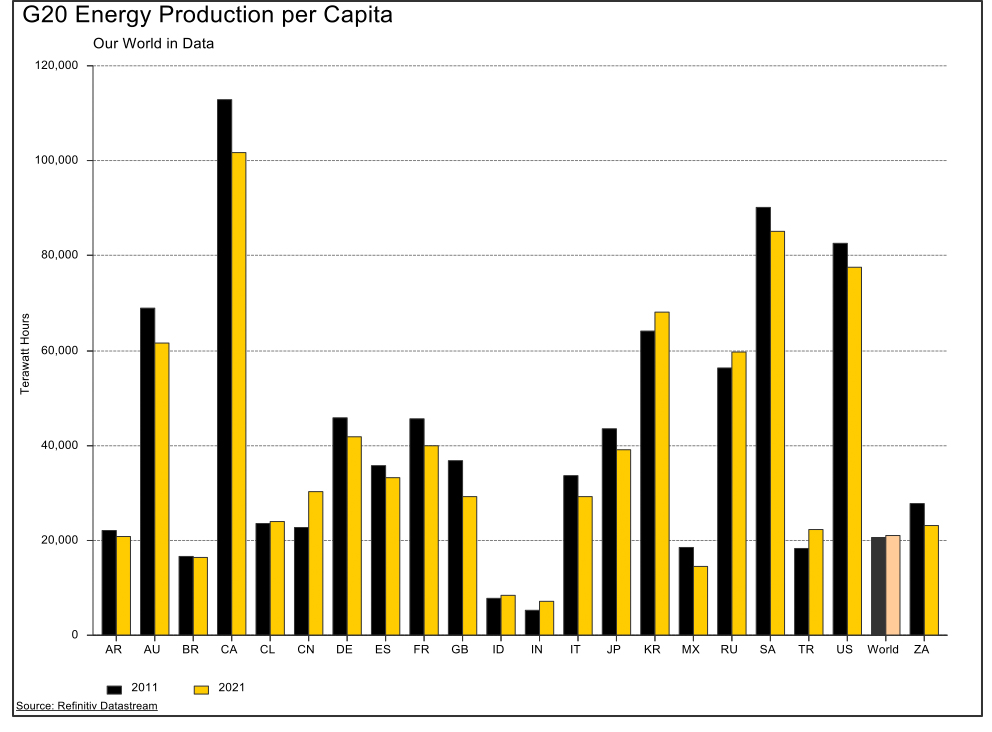
Domestic production capabilities are much greater than those seen in the 1970s, and it is worth noting that the United States also exports over 25 percent of domestic crude.
Replenishing America’s SPR
The current plan to refill the SPR is based on market prices.
Crude oil needs to fall over 20 percent from its current price per barrel to reach replenishment target levels set by the Biden administration. Neither the Energy Information Administration (EIA) nor Consensus Polling data from Reuters forecasts a drop to those levels anytime soon.
The White House said: “The Administration is announcing its intent to use SPR repurchases to add to global crude oil demand at times when the price of West Texas Intermediate (WTI) crude oil is at or below about $67 to $72 per barrel.”

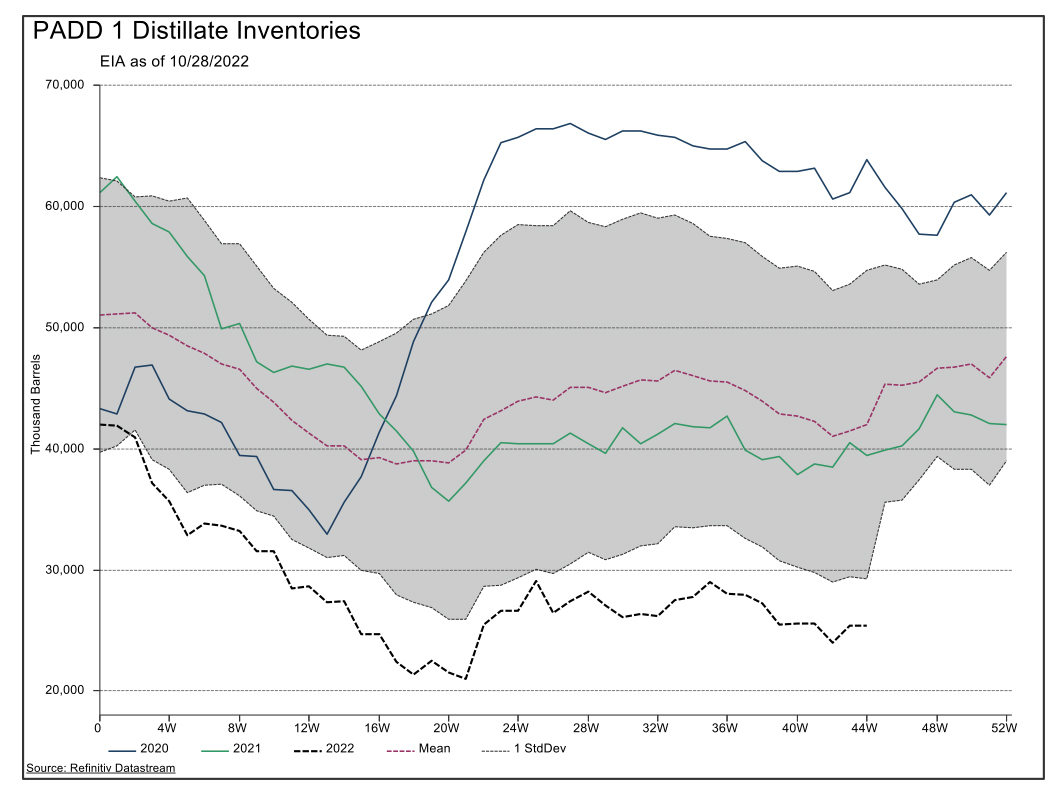
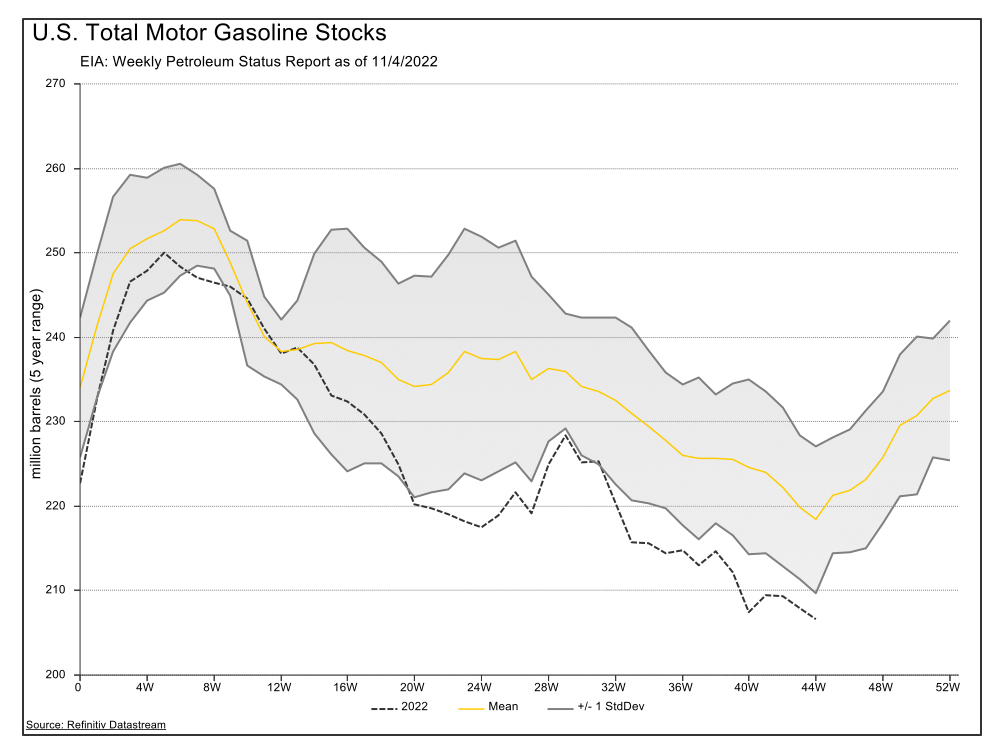
Seasonal stock levels
The supply of gasoline and distillate are at seasonal lows on a five-year basis.
What factors are driving the price of oil?
The Federal Reserve Bank of New York releases a weekly report to capture the drivers behind realised price change of oil. Looking at the decomposition of the price change in crude on a cumulative basis over 2022, it should come as no surprise that supply has been the largest driving factor.
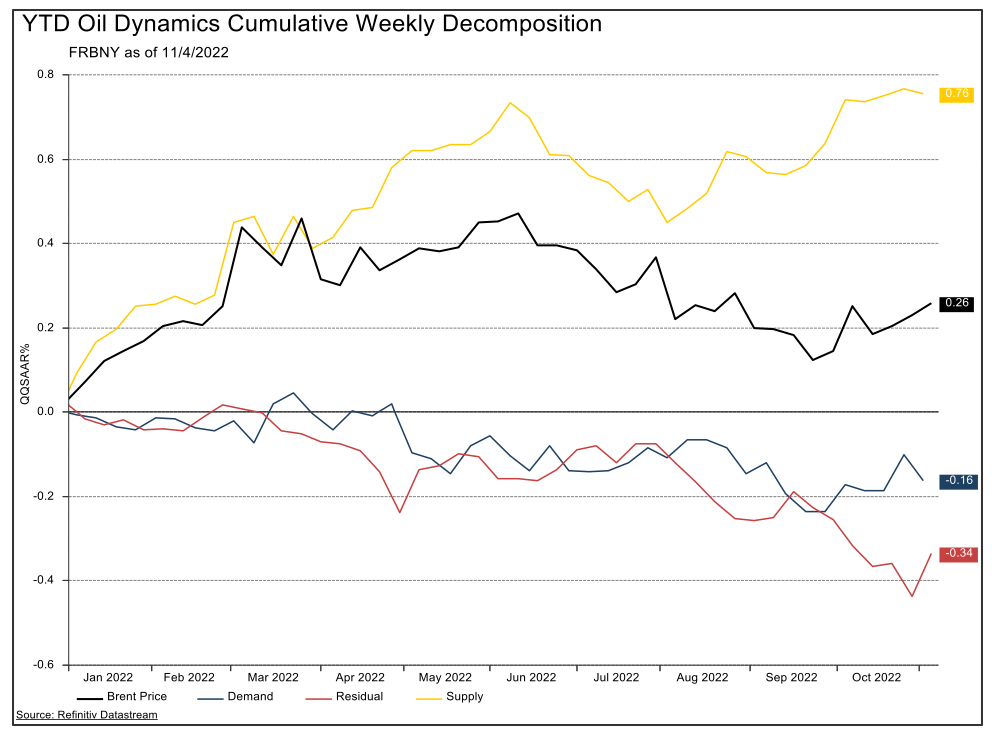
The Federal Reserve Bank of New York reported: “The output of the model is used to decompose weekly changes in an accounting sense. More specifically, the weekly Brent crude price change always equals the change explained by demand factors plus the change explained by supply factors plus a residual (the weekly change unexplained by the sum of the estimated demand and supply factors).”
What is the market sentiment?
For 2022, fewer than 40 percent of investors have a bullish outlook for natural gas while bullish sentiment remains around 50 percent for crude oil.

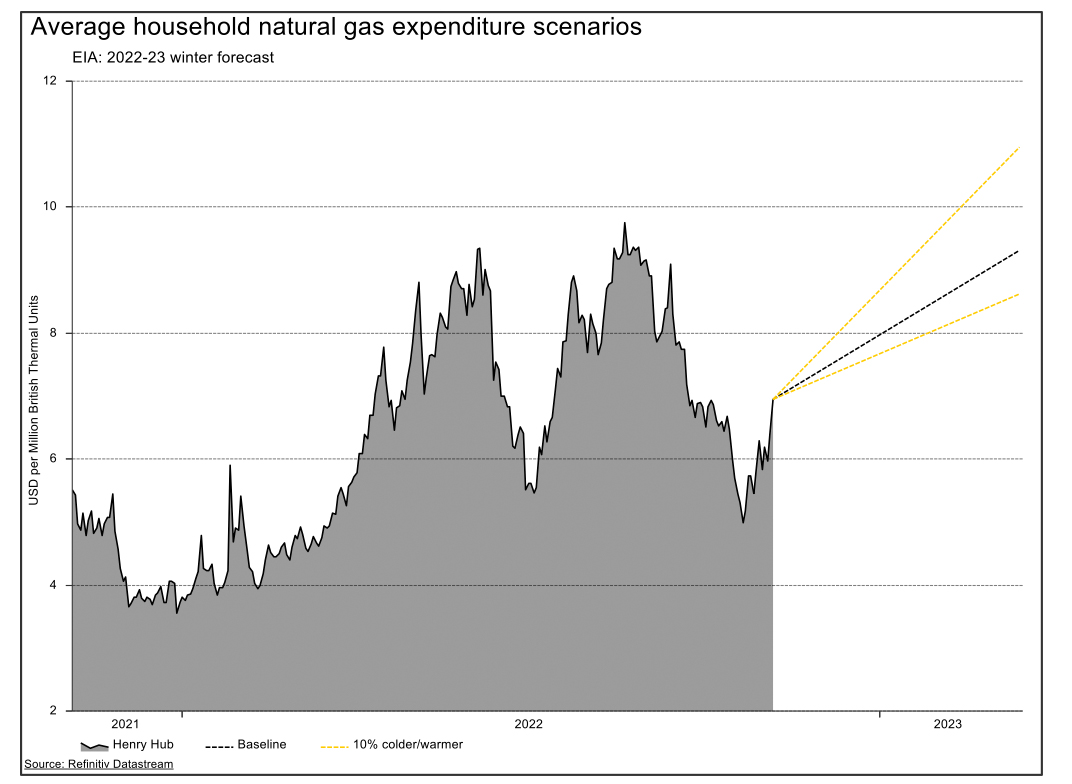
What are the prospects for winter 2022-23?
Although bullish sentiment for natural gas is waning, the EIA base case scenario for the coming winter sees a 28 percent increase in price on an annual basis.
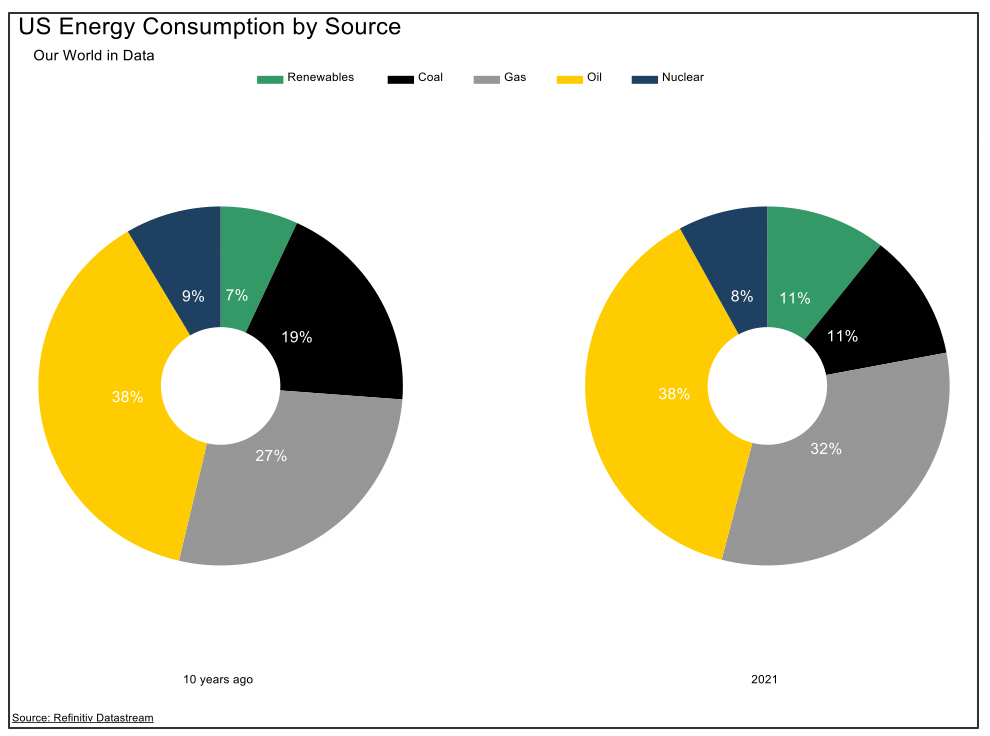
How have things changed over the last decade?
Renewables consumption in the United States has only increased 4 percent since 2011, although coal consumption has decreased by 8 percent. On a per capita basis there as been a minuscule increase in production on a global scale.