

During 2022, investors were challenged by the volatility in equity factors performance. However, some investors were able to generate excess relative returns by diversifying their portfolio across factors.
- 2022 was a very tough year for all asset classes, and global equities lost one-fifth of their value.
- Many quantitative equity investors suffered because of a sudden regime change in equity factor outperformance, which led to abrupt performance swings.
- But we outline two strategies which blended equity factor exposure and performed very strongly last year.
For more data-driven insights in your Inbox, subscribe to the Refinitiv Perspectives weekly newsletter.
2022 was extremely challenging for most investors. The Ukraine war sparked sharp rises in energy and food prices. Inflation soared as post-pandemic restrictions were lifted amid continuing supply-side constraints. Interest rates rose in response and bonds recorded their worst price falls in three decades. Equities fell by nearly 20 percent worldwide.
Within equity markets, a regime change took place.
As recession fears grew, growth stocks slumped after several years of outperformance. Value stocks had a better year in relative terms, though still recorded price declines: taking two leading global equity style benchmarks, the FTSE All-World Value Index fell 8.3 percent in 2022 while the FTSE All-World Growth Index dropped as much as 26.2 percent.
Many quantitative equity investors suffered ‘whiplash’ as they tried to time market shifts between two widely followed factors – momentum and value – that often move in opposition to each other.
Unfortunately, predicting which factors will perform best in the short or medium term is usually a thankless job. Instead, a more fruitful portfolio construction approach is to diversify across factors to generate excess relative returns.
Both the negative historical correlations between value and momentum factors and the low or negative correlations among other selection factors can smooth out returns when those factors are combined.
Read the White Paper: StarMine Combination Model Performance in Down Markets
Outperformance in 2022
Two models based on these approaches delivered outperformance last year. Taking the U.S. equity market as the underlying asset class, two models – Value-Momentum and Combined Alpha – were the best-performing factor models over the nine months to September 2022 (see chart, below).
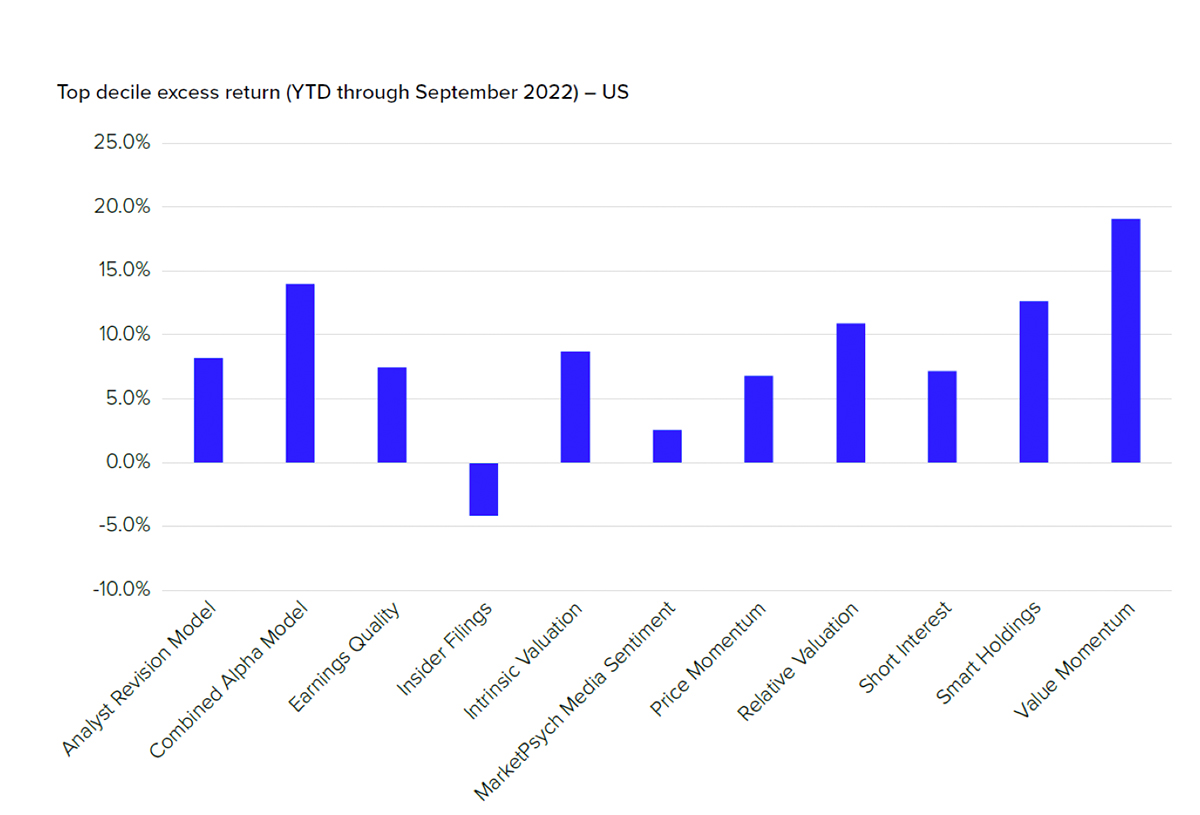
For more on these inputs and the construction of these and other StarMine models, click here, but in essence, the StarMine Value-Momentum (Val-Mo) model condenses proprietary information in our valuation and momentum models into one signal, while the second StarMine factor combination model, Combined Alpha (CAM), is an optimal, static, linear combination of all available alpha models.
As our paper StarMine Combination Model Performance in Down Markets sets out, the top deciles of the Value-Momentum and Combined Alpha models had excess returns of 19.1 percent and 14.0 percent, respectively, over the equal-weighted average price change for the overall stock universe (-26.1 percent for the period).
A review of the combination models’ performance over a longer period supports the argument for factor diversification.
Over the 75 months between July 2016 and September 2022, U.S. stocks produced a negative return (measured by the equal-weighted average price change of StarMine’s U.S. equity universe) in 28 of the months.
During those down months, the StarMine Value-Momentum produced positive top decile excess returns vs the overall market 57.1 percent of the time (see the first table), a slightly higher outperformance rate than the top decile of the model during all months (56 percent).
However, the Value-Momentum model also proved more effective at ranking U.S. equity performance during down months than during the 75-month period as a whole: it produced a positive top-bottom decile spread during 60.7 percent of down months, compared to 46.7 percent of all months.
The ranking improvement extends beyond the top-bottom decile spread, shown by the average information coefficient (IC) in down months of 0.05, compared to 0.033 for all months (see the second table).
And an analysis of the performance of the four proprietary StarMine models contributing to the Value-Momentum factor (Intrinsic Value, Relative Value, Analyst Revisions and Price Momentum) showed that Analyst Revisions and Price Momentum contributed the most to excess returns over the period.

Turning to the other StarMine factor combination model, over the same 75-month period the Combined Alpha model also had positive top decile excess returns versus the universe in more than 60 percent of the down months.
The inclusion of Short Interest, Smart Holdings and Earnings Quality in the Combined Alpha Model helped generate down-month outperformance: each of those factors generated a top-decile excess return and positive top-bottom decile spreads in a high proportion of the negative months.
Smooth, don’t switch
As we move into 2023, no one knows whether last year’s market volatility will persist. But it’s worth reiterating the key message from Refinitiv’s new research: rather than attempting to predict the short-term returns of equity market factors and switch between them, it’s better to smooth the returns (and, at the same time, gain some downside protection) by combining them.
Read the White Paper: StarMine Combination Model Performance in Down Markets


