

The Russia-Ukraine war has caused dislocations both in energy prices and traditional price relationships. More granular and alternative data sources can help us make sense of an increasingly complex global energy market.
- More granular reporting on physical commodity movements, as well as sources of unstructured data like social media, are likely to play an ever more important role in the markets in future.
- Sentiment indicators derived from unstructured news data – such as social media feeds, blogs and news sites – are increasingly used to help identify tops and bottoms in markets. This is because patterns in such unstructured data often lead price movements, especially at major turning points.
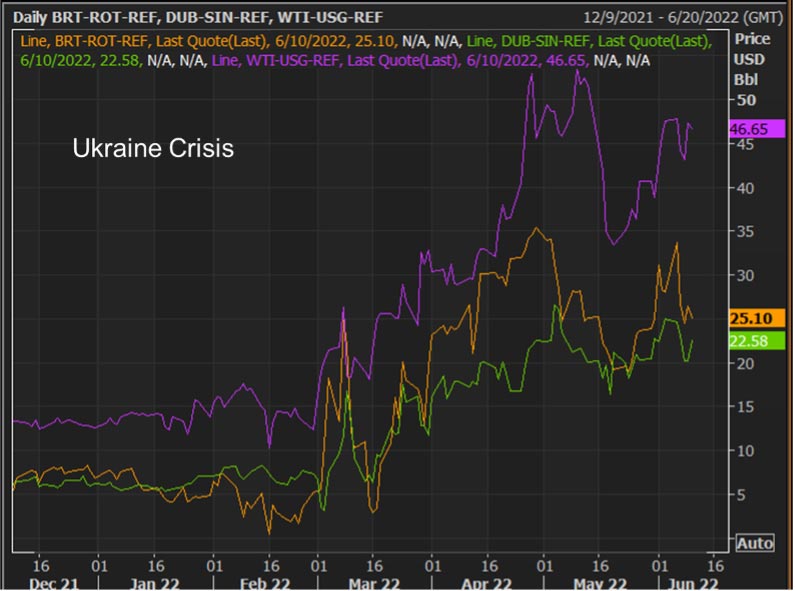
- Refinitiv’s data show that refinery margins surged following the outbreak of war in Ukraine to as much as $50 per barrel, a 500 percent increase from normal levels. Meanwhile, other factors have helped to intensify this year’s energy price squeeze.
For more data-driven insights in your Inbox, subscribe to the Refinitiv Perspectives weekly newsletter.
We’ve gone from glut to famine in the global energy markets in the space of two short years. In April 2020, spot oil prices briefly went negative as the coronavirus outbreak shut down most global travel.
But by March this year, the outbreak of war in Ukraine had caused crude oil, gasoline and diesel prices to hit new multi-year highs.
After all, Russia – which was hit by unprecedented sanctions from the U.S. and European Union countries in response to its invasion of Ukraine – is the world’s commodities superstore.
Lack of investment exacerbating price squeeze
Other factors have helped to intensify this year’s energy price squeeze.
During the past few years, there has been a lack of investment in oil refinery capacity, prompted in large part by the global transition from fossil fuels to cleaner energy.
Adding fuel to the fire, world demand for oil and gas was just returning to pre-COVID-19 levels as economies recovered to a healthy growth rate.
So as Western nations sought to punish Russia for its sudden aggression against its south-western neighbour, energy markets went into panic.
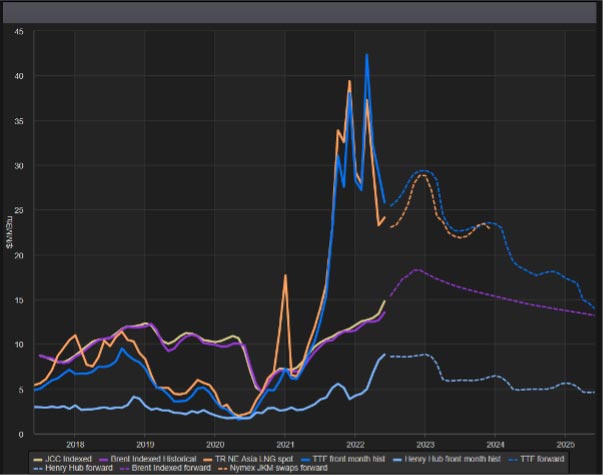
The price shock was especially severe in the European and Asian natural gas markets, with contracts for near-term delivery rising over six-fold in price in a few weeks.
European (TTF) and Asian (TR NE Asia) gas prices soar
Complex global energy market story
These dramatic headline price movements tell only part of an increasingly complex global energy market story.
“We all focus on the WTI and Brent oil contracts, but there are hundreds of crude oil markets and they all trade at premiums or discounts,” Simon Wilson, Refinitiv’s head of oil markets, said during a June panel discussion, sponsored by Refinitiv.
While Urals crude oil – the benchmark grade for Russian oil exported to Europe – dropped to a huge $35-per-barrel discount to Brent crude in early April, reflecting the sanctions placed on Russia, West African crude oil rose to a simultaneous $7-per-barrel premium.
Refineries around the world are optimised for a particular grade of crude oil, with specified density and sulphur content.
So the sudden interruption of Russian oil flows to Western European refineries caused a scramble for other oil grades – such as those produced in Africa – that could easily be substituted for the missing Urals crude.
Russian oil exports diverted eastwards
Meanwhile, a major geopolitical shift occurred, with China and India refusing to back the U.S./European sanctions on Russia and continuing to do business with the commodity superpower.
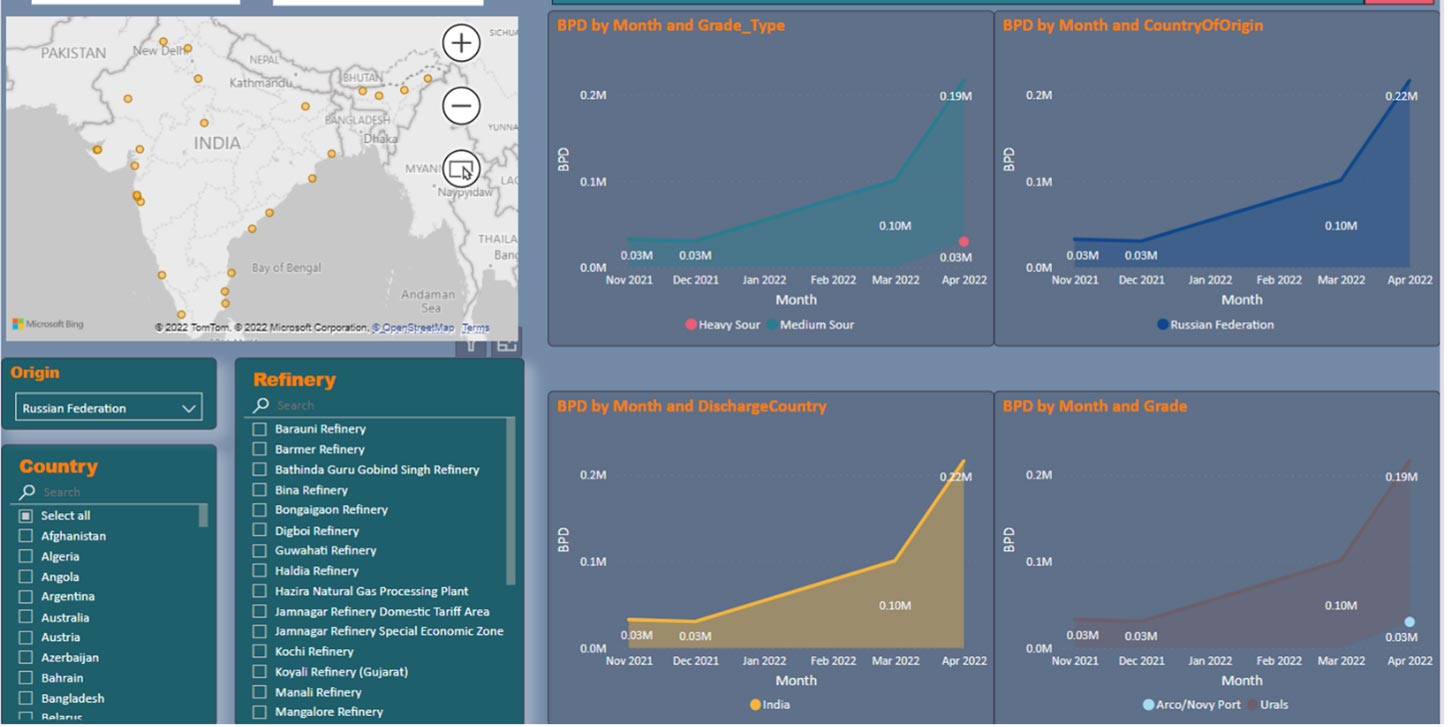
As a result, Russian oil exports have been diverted eastwards, with Refinitiv’s data – which track cargo flows by grade to port and refinery – showing a surge of activity in the first and second quarters of 2022.
The volumes of Urals crude discharged in India rose by more than sixfold between December 2021 and April 2022, for example.
Russian oil heads to Indian refineries
According to Refinitiv’s Wilson, analysts increasingly wish to understand the finer physical details of global oil market flows.
“Our customers want to know what the true grade is going into a particular refinery, what the substitution level is and what the refining margin is, not only at the country level, but also at the individual refinery level,” he said.
Investor interest in this topic is unsurprising: Refinitiv’s data show that refinery margins surged following the outbreak of war in Ukraine to as much as $50 per barrel, a 500 percent increase from normal levels.
Refinery margins surge
Sentiment indicators help identify market trends
Meanwhile, alternative technologies are helping shine new light on price dynamics in energy markets.
Sentiment indicators derived from unstructured news data – such as social media feeds, blogs and news sites – are increasingly used to help identify tops and bottoms in markets. This is because patterns in such unstructured data often lead price movements, especially at major turning points.
According to Josh Clark-Bell, a quantitative researcher at MarketPsych, this year’s war generated the strongest signals for years in MarketPsych’s ‘violence’ index – a measure of the relative frequency of violence-related terms in real-time news feeds.
“The Russia-Ukraine war has been the most referenced violence event in the last 20 years,” said Clark-Bell.
For example, a violence ‘flag’ in MarketPsych’s oil sentiment data is triggered when the commodity is experiencing high levels of violent text relative to normal (specifically, whenever the current day’s violence index for crude oil is 1.5 standard deviations above the mean).
Periods of past high violence are shown in red shading in the chart below.
Interestingly, a violence flag has commonly been activated before the dates on which particular historical events are reported as having occurred. And the violence flag often appears to coincide with market reversals (in both directions).
MarketPsych oil violence flag highlights market turning points

Surprisingly, more and more energy market participants are paying attention to these non-traditional sources of information.
More granular reporting on physical commodity movements, as well as sources of unstructured data like social media, are likely to play an ever more important role in the markets in future.
“The data side of the energy markets is only going to accelerate,” said Refinitiv’s Simon Wilson. “And we’re going to see more and more integration of the physical market with paper trading and the headline numbers that we see.”
Be the first to access new research and content updates Subscribe to our Quant newsletter


