

October’s Market Voice analyzes the misalignment between equity markets hitting record highs and economic performance that has been severely compromised by COVID-19, and also looks at the market reaction to the prospect of a ‘no-deal’ Brexit.
- In spite of the continuing economic impact of COVID-19, equity markets have rebounded strongly from lows earlier in the year. The SPX Price/Earnings ratio is now at a level last seen 20 years ago during the “Dot.Com” bubble.
- Over the coming months, equity prices will be affected by factors including the U.S presidential election, the prospects of a further stimulus package, and the success of efforts to combat the spread of COVID-19.
- The weakening trend in UK equity markets appear to reflect concerns that a no-deal Brexit could create havoc on the UK economy.
For more data-driven insights in your Inbox, subscribe to the Refinitiv Perspectives weekly newsletter.
Equity markets rally despite COVID-19 risks
After the roller coaster ride in the spring when news of COVID first hit the market, equity prices have been on a seemingly relentless march higher. The SPX broke to record new highs in August despite continued COVID-related economic disruptions.
Since mid-August, the market has run into headwinds. The economy shows signs of renewed weakness and is consolidating, but it is still holding near the pre-COVID highs. COVID has badly compromised economic performance and corporate earnings, so the rising market has led to an increase in general Price/Earnings (PE) ratio — a common benchmark for relative equity valuation.
Turbocharge your analysis with Refinitiv Eikon
As shown in Figure 1, the PE ratio is around 27, a level last seen during the ‘Dot.Com’ bubble 20 years ago, suggesting the rebound has taken equities into historically expensive territory.
Figure 1: SPX Price Performance and the Price/Earnings (PE) Ratio (weekly closes)
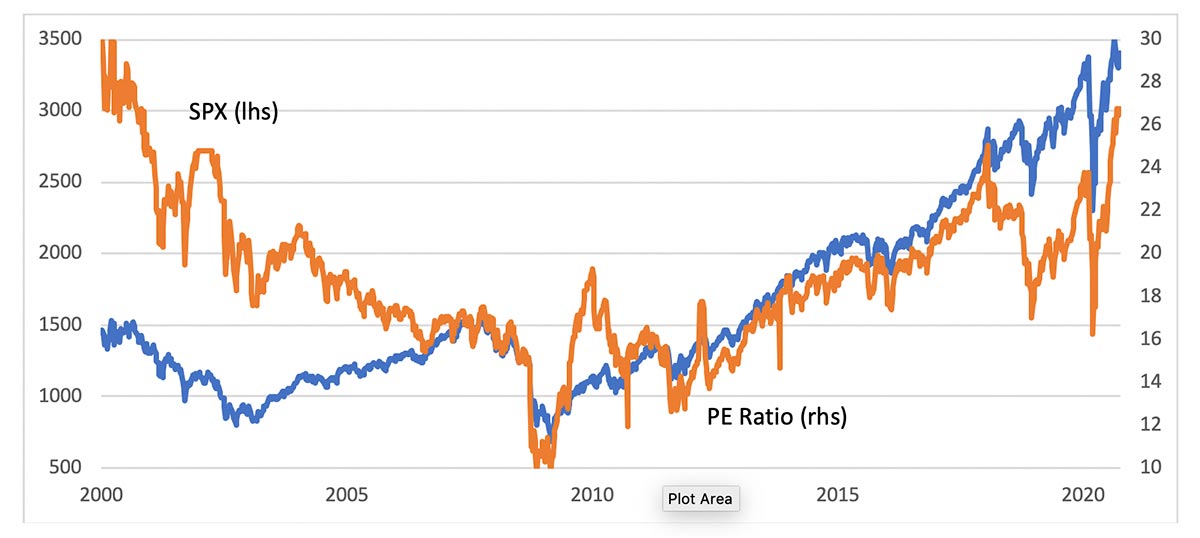
Figure 2 suggests the price recovery has not only made equities expensive but also misaligned with the level of economic activity. The chart demonstrates the historic linkage between equity market year-over-year gains and the pace of industrial production growth.
Following the burst of the Dot.Com bubble, the recovery in equity prices significantly lagged the rebound in activity, while the improvement was coincident in the wake of the 2008 financial crisis.
The SPX is roughly 8 percent above its year-ago level; by historical standards, this is dramatically misaligned with an economy still suffering from activity that is sharply negative. As with the PE ratio, this paints a picture of significant overvaluation in equity prices.
Figure 2: U.S. Economic Activity (Industrial Production) and SPX Price Performance

Federal Reserve asset buying
There appears to be little doubt that equity prices are expensive in terms of the PE ratio and historical performance vs. economic activity. But the unprecedented asset buying by the Fed in the wake of the COVID has pushed U.S. Treasury rates to record lows. And they have expanded their buying activities across a range of markets, so corporate bond rates are also plunging into new territory.
As shown in Figure 3, both the U.S. Treasury and AAA corporate bond rates are now below the average dividend yield for the stocks in the SPX index. Stocks may be expensive vs. their own history, but arguably are actually cheap relative to bond prices.
Figure 3: SPX Dividend Yield Compared to 10Y Treasury and AAA Corporate Rates

Another supportive factor for equity markets is that fund managers appear to be near record levels underweight exposure.
Figure 4 shows the monthly Reuters survey of institutional investors that allocate to both stocks and bonds in the U.S. market. The allocation to fixed income started creeping higher in the middle of last year and this trend accelerated as COVID-19 hit the economy.
Equity holdings remained stable last year (the losers were cash and alternatives), but have plunged since the middle of this year. It appears that the portfolios were lightening up on equity exposure even as the market recovered to new highs and equity allocation is below bonds for the first time since the survey data has been collected.
Figure 4: Allocation to U.S. Bonds and Equities by Global Diversified Asset Managers

How will politics impact equity performance?
Equity performance over the next few months will clearly be affected by politics — the U.S. presidential election and prospects for another stimulus package — and the progress in containing the spread of COVID-19.
Although stocks seem expensive from a historical perspective, downside should remain limited as long as bonds also remain at their current extreme levels of valuation.
For live updates on the impact of COVID on the markets and economic activity, visit the Eikon COVID page.
Watch: Eikon — The ultimate set of tools for analyzing financial market
For a comprehensive overview on our election coverage, including updates on the Global Markets Forum, webinars, data insights and more follow our U.S. Election page.
Market showing modest concern on Brexit
The end of the year is fast approaching bearing the prospect of a ‘no-deal’ Brexit.
While negotiators continue to work on a trade agreement to provide a framework when the UK leaves the European Common Market, there are difficult issues which are unresolved, such as the Northern Ireland border and government subsidies.
Figure 5 shows that the UK market has been an underperformer this year, steadily losing ground to both the U.S. and European markets.
It seems the weakness is not tied specifically to COVID-19 because the downtrend emerged late last year and has continued apace in recent months. It does appear that the FTSE is starting to stabilize this past month, so there may be some optimism building on a trade deal emerging.
The implications of a no-deal Brexit remain unclear. However, there is certainly the potential of it creating substantial disruptions and shortages in the UK, so further FTSE declines seem likely if the calendar turns to December without an agreement.
Figure 5: UK FTSE Performance vs. the U.S. SPX and the European STOXX Indices

The currency market is also showing some nervousness of Brexit related disruptions.
As shown in Figure 6, implied volatility for the GBP vs. USD picked up sharply during the COVID-19 crisis, but remains near the highs of last year.
Shorter-term realized volatility is below implied volatility and trending lower, so it is likely that option values will drop sharply if a trade deal is signed. The 1Y credit default swap (CDS) on UK sovereign borrowing has generally tracked the risk priced into the GBP option market but has mean reverted more quickly.
With the CDS trading near decade plus lows, this seems a cheaper alternative for investors looking for protection from a no-deal Brexit.
Figure 6: 1Y GBPUSD Implied Volatility and the 1Y UK Credit Default Swap (CDS)

The weakening trend in UK equity markets appear to reflect concerns that a no-deal Brexit could create havoc on the UK economy. This concern is also reflected in somewhat elevated implied volatility priced into GBP options.
The UK 1Y (and longer) credit default swap appears under-priced given the risks priced into other UK markets, making this a relatively attractive way to hedge the risk of a no-deal Brexit.
The Eikon Brexit page has live updates on the impact of Brexit on the markets and UK economic activity.
Turbocharge your analysis with Refinitiv Eikon


