

A few months ago, Michael Smith explored the volatility of volume for U.S. equities. He now focuses on ETPs (exchange traded products) and the total turnover over the past few months, and uses Refinitiv’s Market Share Reporter (MSR) data feeds to analyse the activity.
- While U.S. equities are some of the most widely traded instruments in the world, so are ETPs or exchange traded products.
- Using the Market Share Reporter (MSR) app in Refinitiv Eikon, we explore global equities from 200 venues and normalise the data not only by turnover volume, but also look at how these instruments trade.
- Commodities and alternative ETFs are among the most interesting groups seeing jumps in turnover.
For more data-driven insights in your Inbox, subscribe to the Refinitiv Perspectives weekly newsletter.
ETPs is the more accurate name for a stable of products that includes exchange traded funds (ETFs); exchange traded notes (ETNs), of which XIV was a popular example before it blew up in 2018 Volmaggedon; and exchange traded commodities (ETCs), which are much more popular in Europe than in the U.S.
Our colleagues at LSEG provide some highlights around ETCs here.
Refinitiv Eikon gives you the information you need – whenever and however you want it
Analysing ETP trends
I have used our Market Share Report (MSR) data feeds to explore the last few months of total turnover in ETPs. I wanted to see if there’s been any recent change of total turnover in both the U.S. and Europe by several types of ETP. Again, using turnover in place of volume to normalise the value traded.
MSR allows me to take global equities from 200 venues and normalise the data not only by turnover volume, but also by looking at how those instruments to trade. There are more than 500 trade classifications across those 200 venues, and MSR brings those down to 19 in Europe and eight for the rest of the world.
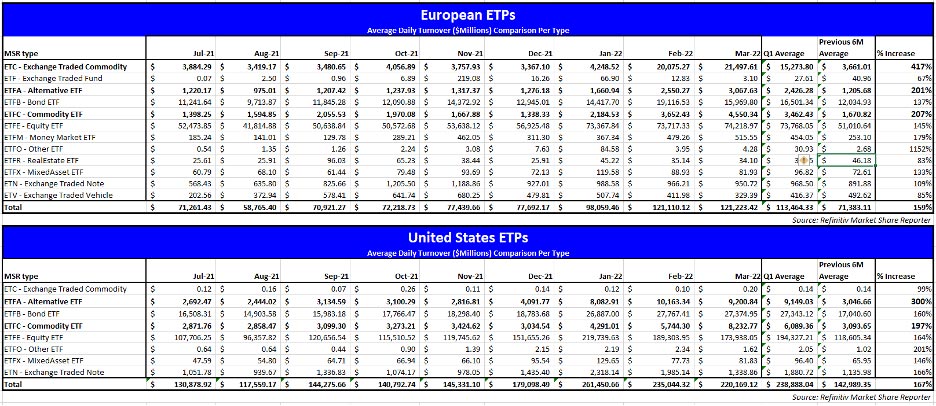
In Figure 1, we can see how much larger turnover is for names in the U.S. versus their counterparts in Europe.
In Q1, ETPs in Europe traded north of $113bn of turnover per day. That is 59 percent higher than the H2 2021 average.
In the U.S., the ETP turnover was more than $100bn more per day. The U.S. turnover was $238bn in Q1, which was 67 percent higher than H2 2021. The U.S. started trading more in December, carrying that over to a huge January and Q1, whereas Europe had a nice bump in January and really did not ramp up until February.
Figure 1
Commodity ETPs
With the recent global macro events and some of the market dislocations in commodities, those events have been driving trading in Commodity ETPs relative to their recent history.
Commodity futures have been in the news but are generally only accessible by professional traders. Commodity ETFs, on the other hand, allow everyone to make investments/trades in this space.
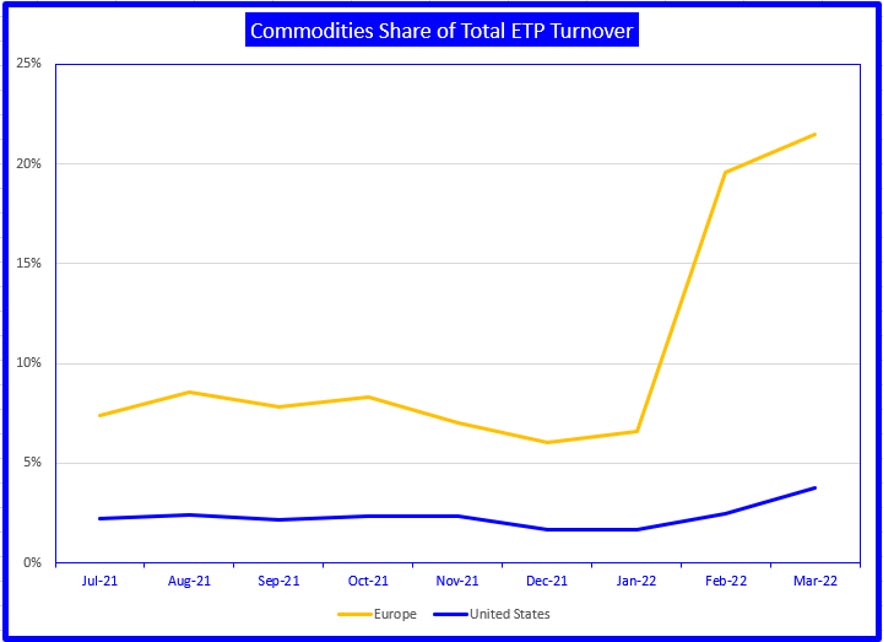
In Europe, ETCs are traded much more than in the U.S., both in total and relative to the total ETP turnover. When you combine the ETCs and the commodity ETFs, Figure 2 shows much higher their normal share is, but the jump in the last two months is so much greater.
Figure 2
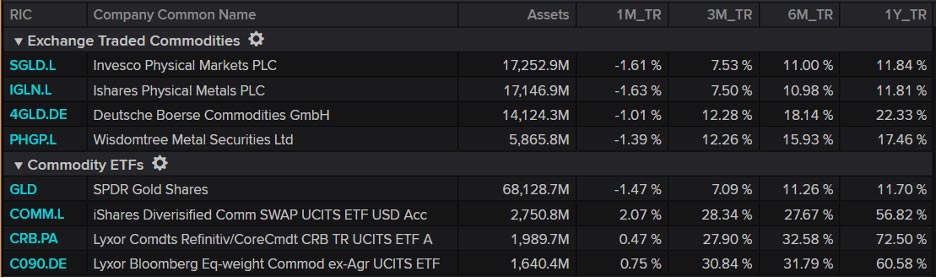
What are these ETCs? Figure 3 shows the top four by turnover for the ETC and the commodity ETF categories.
IGLN and SGLD accounted for 25 percent of the total turnover for Europe in March and 5 percent of the total ETP turnover. In the U.S., GLD is 48 percent of the commodity ETF turnover and 2 percent of all ETP turnover in March.
Figure 3
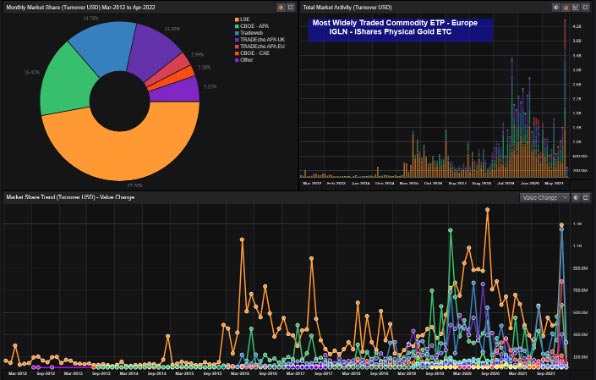
Staying on these top-traded names. I went to the Market Share Reporter app in the Eikon desktop (Figure 4) to look at IGLN and GLD on an individual basis. You can clearly see the jump in trading in March.
IGLN traded more than $4bn notional, which is over 32 percent higher than the previous high in March 2020. Here, you can also see that the security trades just under 50 percent of its notional volume on the LSE, but in March we saw a huge jump in volume on Tradeweb as well. That’s the lower line chart. March saw north of $1.2B on both LSE and Tradeweb.
Figure 4
More turnover or returning flows?
Has there been just more turnover or are flows are coming into the fund?
Figure 5 looks at the Lipper Fund flows app in Eikon. Lipper Fund flows date back to 1992 and helps investors and traders understand where capital is moving. It shows the giant inflows in iShares Physical Gold ETC. The Invesco Physical Gold ETC took in more than $2.8bn, which was a bit more than iShares’ $2.2bn. Both were by far the most in a long time.
When combining the flows and the turnover, Figure 6 shows that 10 years ago, SGLD was probably more of a trading vehicle. As it gained assets, trading calmed down a bit and both it and IGLN had settled in the low 10s. Both have seen a small bump into the 20 percent range in the last month.
Figure 5
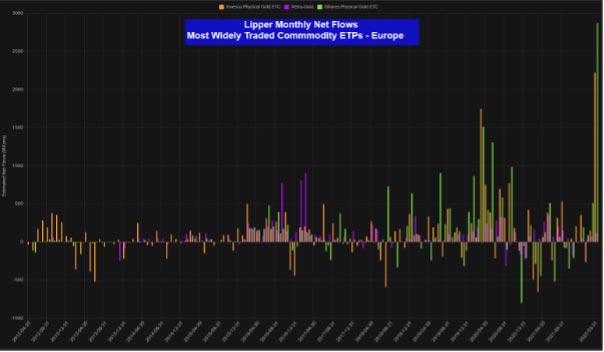
Figure 6

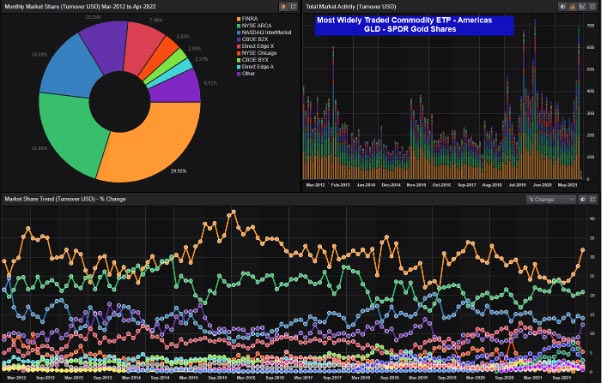
The SPDR Gold shares (Figure 7), which mainly trade in the U.S., are far more active than both ETCs in Europe, trading almost $70bn in turnover in March. That was only second in terms of monthly turnover.
Just behind the $72.6bn traded in August of 2020. It is the fourth month in the last 10 years where the fund traded north of $60B in turnover. I do see a slight turn in the FINRA ADF volumes over the last three months, but those are still less than the 40 percent share that traded on that tape in March 2016
Figure 7
Lipper flows for GLD
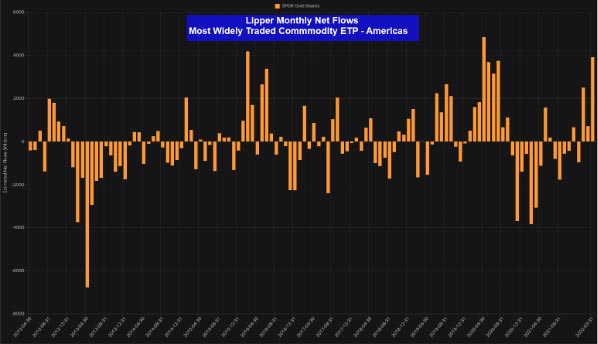
With the Lipper Fund Flows app for GLD, you don’t see the same jump inflows as you do with the European names, but looking at the Y-axis in Figure 8, the numbers here are much larger. The $2bn in inflows has happened 15 times during the last 10 years for GLD. However, it did see inflows of $3.9bn in March.
Figure 8
In Figure 9, the total assets of GLD and turnover by month show that March was quite active, trading more than 100 percent of the assets. This is not anomalous and has happened before.
Figure 9

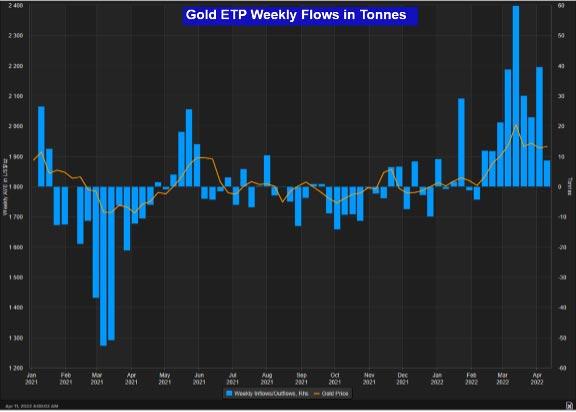
The Metals Research team at Refinitiv looks at the flows in a different light. They take the daily flows from roughly 75 funds worldwide and aggregate these flows into an amount of gold to buy or sell.
Figure 10 shows the weekly flows of gold from those products. Flows are decidedly positive since the situation in Europe became more stressed.
Figure 10
Those daily flows are then aggregated to look at the change in monthly flows by region (Figure 11).
Figure 11
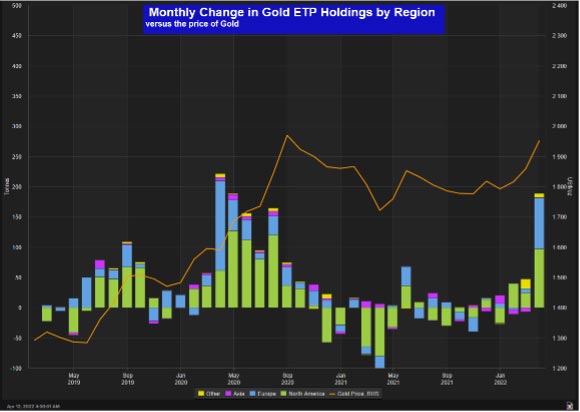
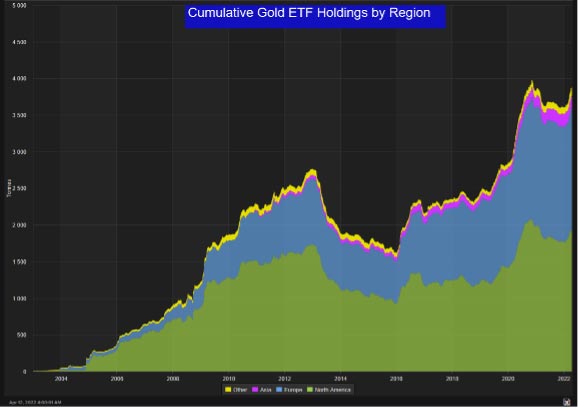
Figure 12 shows a cumulative chart of gold holding stacked by region.
Figure 12
The chart in Figure 13 looks at the global flows of Commodities ETPs by Lipper classification, which shows more categories of commodities.
Figure 13

Alternative ETFs
Commodities were an interesting subject because of the large jump in Europe, but another segment of note in Figure 13 is alternative ETFs. Their volumes are again smaller than their U.S. counterparts.
These funds have about half of the turnover of commodities in Europe and roughly the same in the U.S. Both regions have seen a recent jump in turnover for this segment, more than doubling their turnover. The U.S. aggregate turnover was more than three times the values seen last summer.
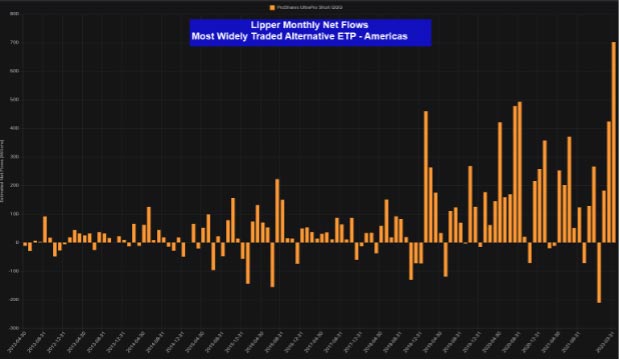
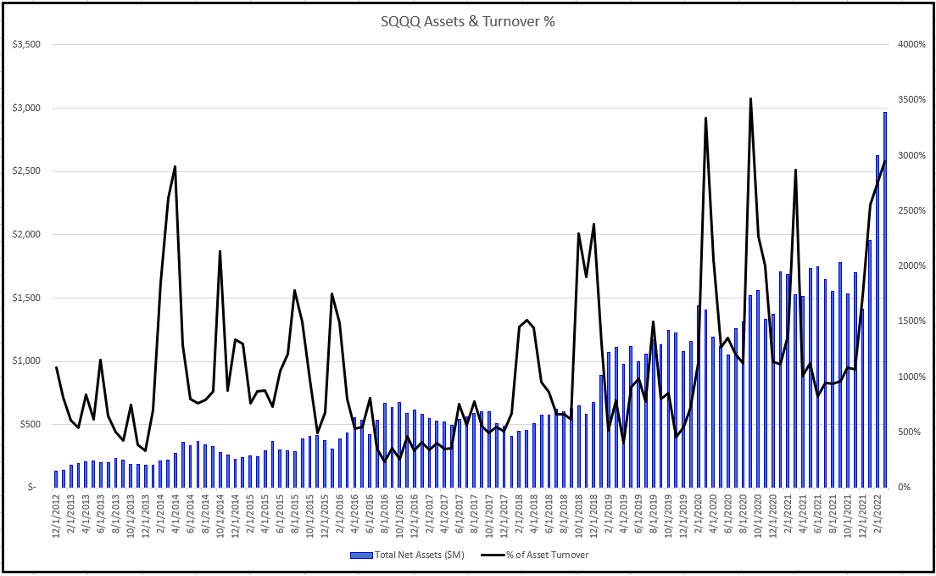
The largest name in this bunch is ProShares UltraPro Short QQQ. Figure 14 shows the wave of inflows in the last few years and the burst higher in March. In March, SQQQ took in $250m, and helped the annual total hit $2.4bn in the last year.
Figure 14
SQQQ is the largest of the names we have highlighted by turnover.
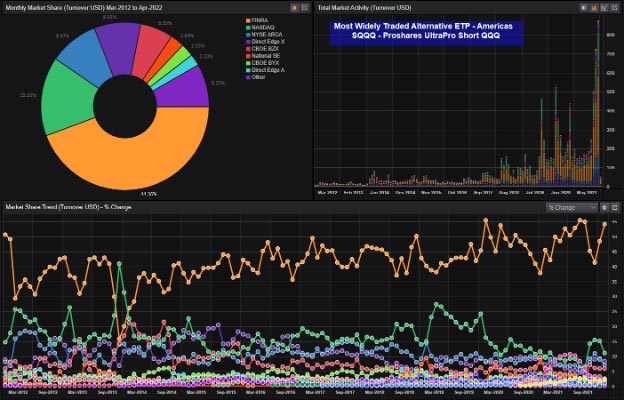
Figure 15 shows the recent spike in the Market Share Reporter app while the increasing percentage of printing on the FINRA ADF is also of note.
In March, SQQQ traded more than $87bn of notional, which was an uptick from an already strong February, when it totalled $72bn in trades. The largest day of Q1 was 24 February when it traded $7.1bn in notional value.
The other top names in the alts space were SDS, which is the ProShares UltraShort S&P500 that is 2x leveraged, and SH, which is ProShares Short S&P 500.
Those two traded $12.2bn and $11.9bn respectively in March. I expanded the alternatives in the U.S. to the top six and they were all inverse levered funds, except the SH.
Figure 15
SQQQ is a true trading vehicle. With GLD, we saw numbers briefly hitting 100 percent of asset turnover, but with this instrument, the lowest we see is about 400 percent of assets.
Figure 16
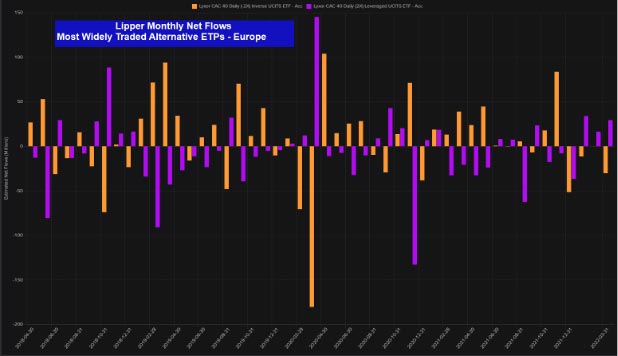
Europe did not have a top gun like the U.S., but the Lyxor CAC 40 Daily 2x funds were the top two names. BX4 is the 2x Inverse and LVC, the 2x Leverage, was a close second. They traded $1.3B and $1.2B respectively for March.
Figure 17
Commodities drove ETP trading
From this analysis, we can see the news around commodities drove a bunch of trading in the ETPs in that space.
The fact that gold was prominent, and that inflation talk dominated headlines, wasn’t too much of a surprise (Figure 18). Gold seems to have gathered some steam in the new year with the futures spiking to over $2,000 per ounce in early March before tailing off a bit.
Figure 18

Fewer bearish bets
The Metals Research team at Refinitiv also focused on the price of gold versus the put/call ratio of the options. Figure 19 shows the ratio getting lower as the price rises. This would indicate fewer bearish bets in the options.
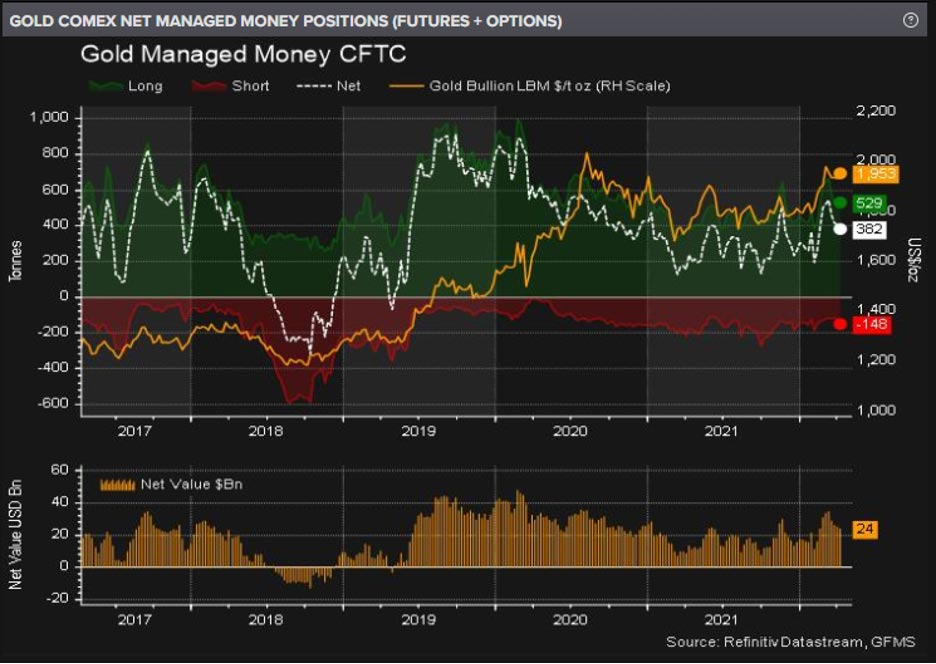
The Commitment of Traders (CoT) report from CFTC (Figure 20) shows the new value of positions for managed money coming off recent highs. The Metals Research team notes this is the third consecutive week net long positions fell after a recent high.
Figure 19
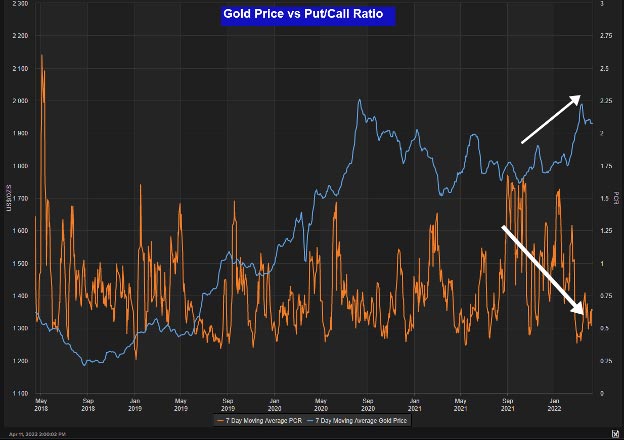
Figure 20
On the alternative side of the book, this one is a bit easier to explain.
Large-cap equities in the U.S. are rolling over and momentum to the downside seems to be the play for traders. This segment’s assets are much larger in the U.S. than in Europe. Figures 21-23 show the largest turnover names, which you can see is mostly U.S. names.
Figure 21

Figure 22
Figure 23

Trends in volume
The Market Share Reporter app in Eikon is great for looking at trends in volume on both a regional and single stock level, but the content also comes in a feed format for more customisation and use on a larger scale. If you are interested in using this for research or tying it in with some real-time data, reach out to your Refinitiv account team.
Refinitiv Eikon gives you the information you need – whenever and however you want it


