

There are signs that the rotation in market leadership is reversing any ‘ESG premium’—though not uniformly. Despite this, flows to ESG funds remain strong. Dewi John uses Refinitiv Lipper data to lift the lid on the UK sustainable fund market.
- We use Refinitiv Lipper data to lift the lid on the UK sustainable fund market.
- The strong performance of energy stocks of late is eroding the ESG equity performance premium.
- Asset flows into UK ESG funds remain strong, and the positive flows trend is extending into other asset classes.
For more data-driven insights in your Inbox, subscribe to the Refinitiv Perspectives weekly newsletter.
The strong revival of energy stocks and value is seeing an erosion of the ‘ESG premium’ in certain top-selling sectors, as conventional Equity Global funds outperform their ESG peers over 12 months to the end of the first quarter.
Comparing ESG and non-ESG performance
Chart 1: ESG Top-Selling Classification Performance versus Conventional Equivalents,
Q1 2022 (Percentage Growth)
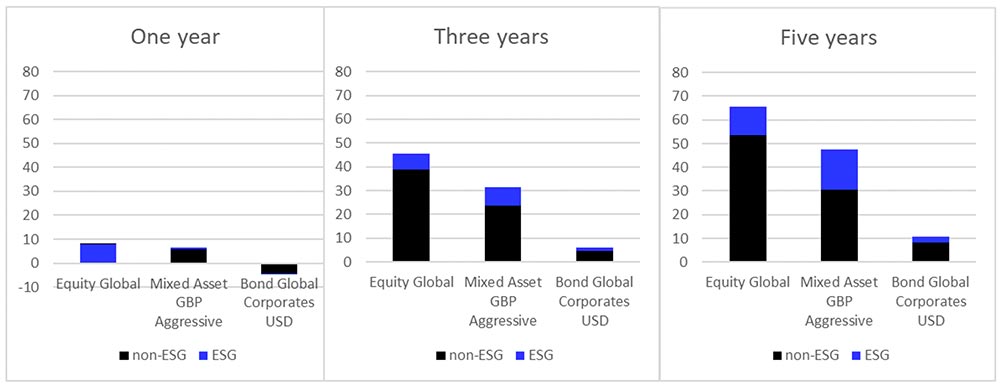
Chart 1 takes the top-three selling sectors for the 12 months up to the end of Q1 2022 and compares the ESG and non-ESG performance within these classifications over one, three, and five years.
Over three and five years, ESG funds are ahead across the three classifications.
That’s greatest for Mixed Asset GBP Aggressive over five years, where the returns are 47.6 percent and 30.5 percent, respectively. Over the longer term, there is a smaller set of ESG funds – and a smaller number still have delivered considerable outperformance – and this will obviously impact the average more than in a larger set.
However, if we remove returns of greater than one standard deviation above or below the median return, this only reduces the average by a couple of percentage points, to 45.8 percent.
Even removing those funds with returns above one standard deviation, but leaving in the underperformers, gives an average of 37.7 percent, so the ‘ESG premium’ – however this is being attained – is still considerable.
Shorter-term market movements are eroding this lead.
ESG Equity Global returns over 12 months trail their non-ESG equivalents by 7.8 percent to 8.3 percent, while bond global corporates USD ESG funds fell by 8 basis points (bps) more than their conventional peers over the same period.
This effect is particularly pronounced in the UK equity market, with a high proportion of energy stocks – which have done particularly well over the past year – and has a relatively pronounced value tilt.
While ESG funds are ahead over three years, by a hair’s breadth of 15.9 percent to 15.8 percent, they lag over five – 22.5 percent to 22.6.percent. And over 12 months, non-ESG funds return an average 7.1 percent to their ESG equivalents’ 3 percent.
Why this is happening exactly is not as straightforward as you might think.
I recently looked at performance in Equity Global Income Lipper Global Classification, which is enjoying a rare purple patch in terms of flows of late.
Mean returns over the 12 months to the end of April for those funds with Lipper’s responsible investment flag returned 10.4 percent, while their “conventional” peers returned 8.1 percent.
Somewhat surprisingly, then, while we’re seeing a distinct value-over-growth bias, it doesn’t seem to be explained by the undoubted outperformance of “dirty” stocks. Indeed, despite this, there is still an ESG premium within this classification – although, without digging deeper, we can’t tell what’s driving it.
Learn how Lipper Alpha can help you seize opportunity with powerful financial analysis
How goes the flows?
Meanwhile, as Chart 2 illustrates, any underperformance of ESG assets has yet to feed through into where investors are choosing to place their bets.
Indeed, there are indications that the brown-to-green rotation we’ve long seen in equities may be feeding through into other asset classes.
Chart 2: Asset class flows, ESG v conventional, Q1 2022 (£bn)
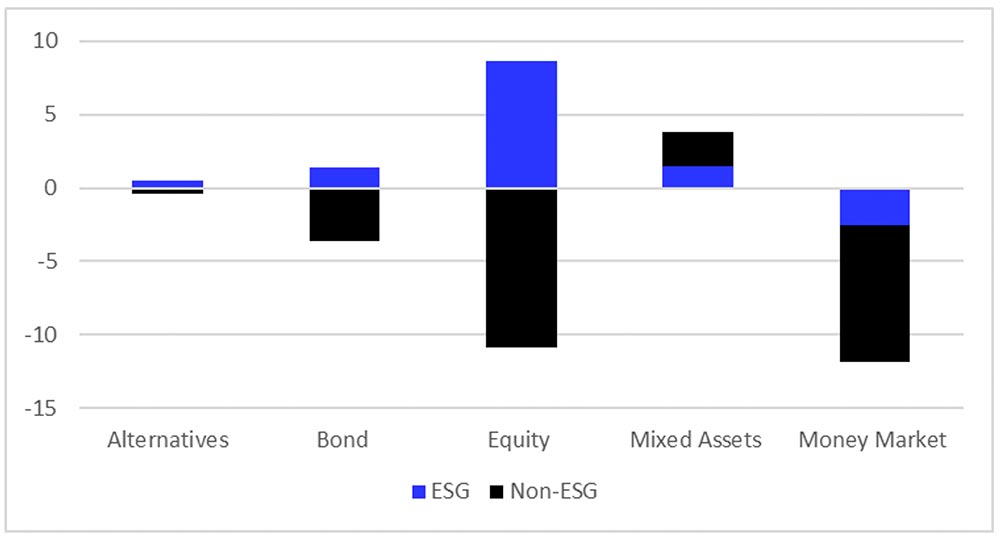
Alternatives, bond, and equity fund flows have been positive for ESG assets while negative both for conventional funds and overall. Equity ESG saw the strongest flows (£8.6bn), as investors dumped £10.8bn of their non-ESG peers.
While this is a well-established trend with equities, there has been a less distinct pattern with other asset classes, so it’ll be interesting to see if the same thing is happening here – investors swapping brown for green assets – and if it can withstand any sustained performance revival of the former.
Mixed assets ploughed their own furrow, with both ESG and non-ESG in the black, and indeed the latter out in front (£1.5bn versus £2.3bn) despite a broad range of ESG offerings in this market.
Lastly, ethical and conventional money market funds were both in the red over the quarter (-£2.5bn versus -£9.4bn), although the negative flows were confined to the first two months, cash fund flows being strongly positive in March.
These figures are broadly in line with the trend over 12 months to the end of March, with ESG flows positive, the largest being to equity funds (£32.9bn) and most non-ESG risk assets seeing redemptions. The exception is multi-assets, where both ESG and conventional funds are in positive territory.
Chart 3: Largest positive ESG flows by Refinitiv Lipper Global Classification, Q1 2022 (£bn) – Versus conventional equivalents
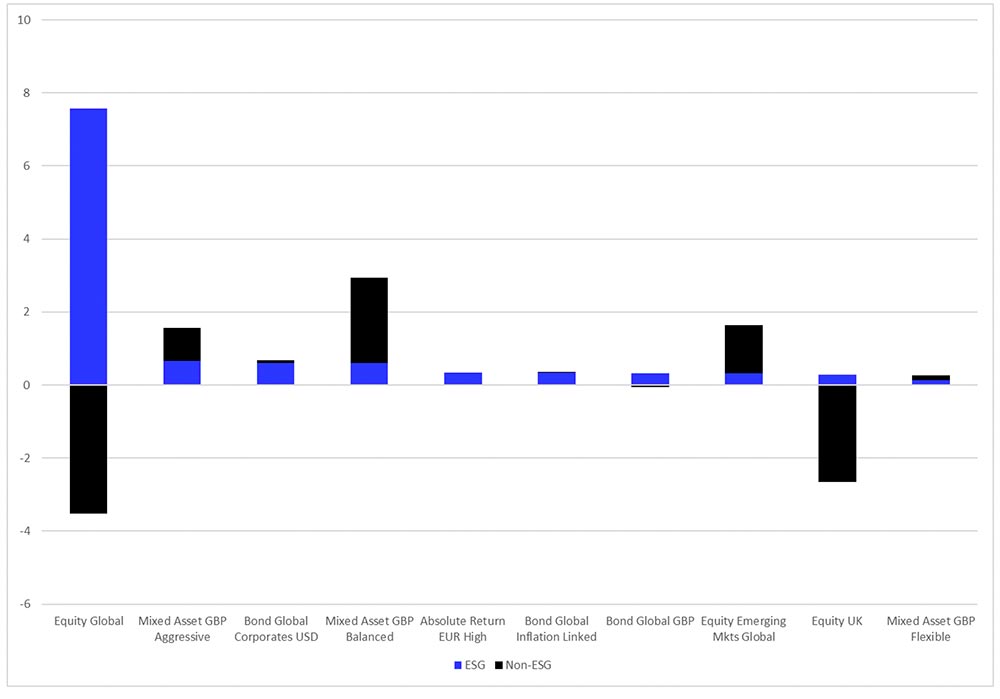
At the more granular level of Lipper Global Classifications, Equity Global continues its domination of UK flows, which we’ve seen for well over a year.
ESG to non-ESG flows were £7.6bn to £3.5bn over the quarter – more than 10-fold greater than the next, Mixed Asset GBP Aggressive (£665m).
What is, perhaps, interesting is that where investors are waking up to the need to insulate the fixed income portion of their portfolios from inflation – Bond Global Inflation Linked – this too is being implemented through an ESG lens, with such funds taking £335m of the £348m total.
Below the top 10, at 18, there are £70m of inflows to Bond Global Short Term ESG funds, as their conventional equivalents shed £107m.
What remains to be seen in future quarters is whether the resilience of ESG allocations is maintained in any ongoing outperformance of oil and gas.
Learn how Lipper Alpha can help you seize opportunity with powerful financial analysis


