

Adam Baron explores how connectivity between corporations is related to financial performance, with companies whose board members are simultaneously on many corporate boards performing better than those whose board members are not so well connected.
- There is a relationship between board connectivity across companies and financial performance.
- Experiments using eigenvector centrality and return on assets as a performance metric indicate that greater centrality can deliver higher performance.
- Further exploration of centrality using NetworkX for Python and content from the Refinitiv Quantitative Analytics database will extend understanding of the relationship between board connectivity and performance.
For more data-driven insights in your Inbox, subscribe to the Refinitiv Perspectives weekly newsletter.
Hypothesis is based on experiments using Refinitiv Officers & Directors, Refinitiv Fundamentals Point-in-Time and Russell 3000 index data sets in the Refinitiv Quantitative Analytics (RQA) database. The outcomes indicate that there is a link between connectivity and performance, and that these data sets can add value when developing models to predict financial performance.
Centrality is a network measure that strives to find the most important nodes (i.e., companies) in a graph and score them accordingly.

I used eigenvector centrality calculations as well as Refinitiv Fundamentals Point-in-Time (PIT) content to calculate Forward 1-Year Return on Assets (FY1 ROA) and evaluate the relative performance of companies based on the eigenvector z-score of their centrality.
The research explored two types of centrality using the open source library NeworkX for Python:
- Eigenvector centrality running calculations across an undirected graph of relationships to determine whether two companies are connected
- Subgraph eigenvector centrality running calculations across an undirected graph of relationships to determine interconnectedness of subpopulations of companies.
Download the research paper: Does board centrality predict future financial performance?
Establishing the connection
Using graph theory terminology, in which a company is a ‘node’ and connection between companies via a shared board member is an ‘edge’, all the relationships in the Refinitiv Officers & Directors data set were represented in a graph.
Network analysis was then deployed to gain insight about each company and its centrality scores, essentially network measures that find the most important ‘nodes’ in a graph and score them accordingly.
There are a number of centrality measures. This study uses eigenvector centrality because it focuses on company pairs that are directly connected by the same board member and provides differing weights to those connections based on the importance of the other company.
Using Refinitiv data and open source tools to run eigenvector centrality analysis
Undirected graph eigenvector centrality
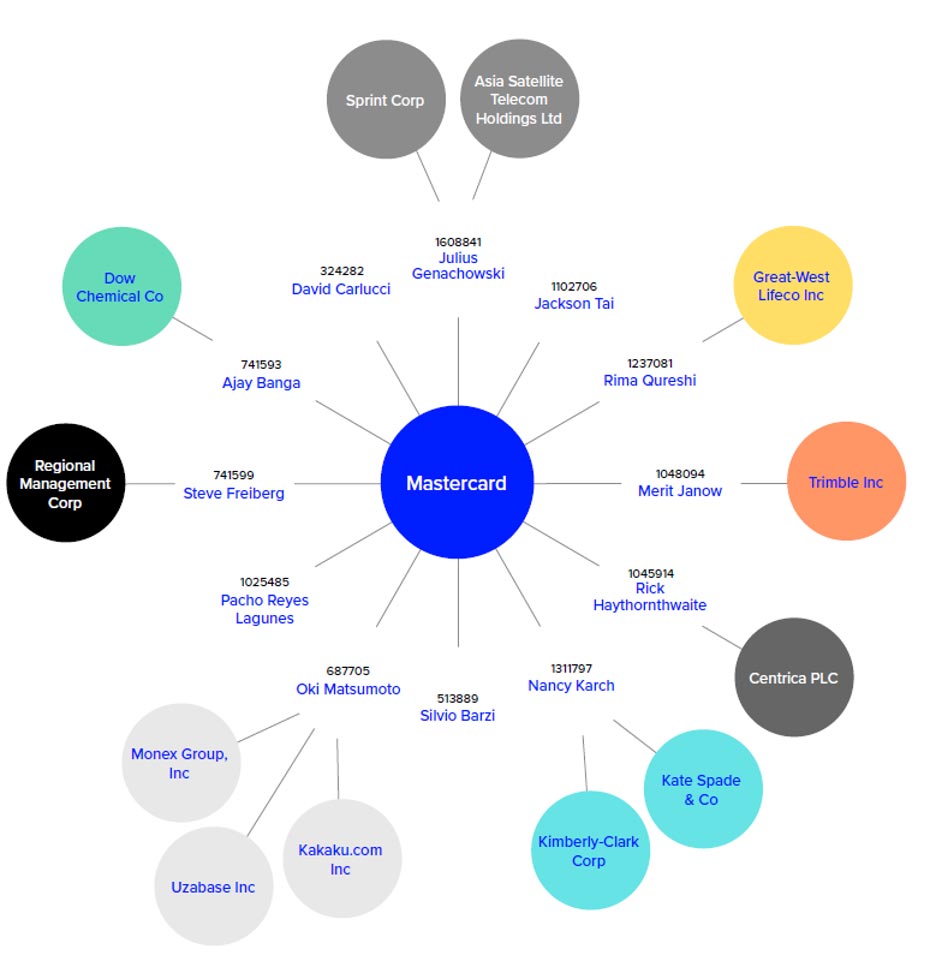
I used NetworkX for Python to create the undirected graph above and eigenvector centrality measures.
To determine whether two companies are connected, the Officers & Directors table from the Refinitiv Quantitative Analytics (RQA) database – which lists which companies a board member sat on between a start and end date – was employed.
Download the research paper: Does board centrality predict future financial performance?
How board connectivity is linked to financial performance
The research demonstrates the importance of board connectivity, and the potential of the Refinitiv data sets used in the experiments to add value when developing models to predict financial performance.
It also provides a starting point for further exploration of the relationship between board connectivity and financial performance.
As different factors of board connectivity – perhaps the addition of new members or the size of the board – are introduced, will this generate similar trends in the relationship between connectivity and financial performance?
These, and other scenarios, can be played out using content from Refinitiv’s Quantitative Analytics.


