


An analysis of the FX data offerings from LSEG, the Blended Rate (TRB), FXall PriceStream data (FXV) and our contributor data (Super RIC).
- While the Super RIC generally reflects the overall market price with indicative pricing, the Blended Rate and Pricestream data offerings, derived from real market activity, reflect the most accurate price in the market and react instantly in highly volatile periods.
- To illustrate the capabilities of the offerings, the research looks at examples using developed market currencies.
- Further examples are shown using emerging market currencies, which showcases our FX strength in these currency pairs.
For more data-driven insights in your Inbox, subscribe to the Refinitiv Perspectives weekly newsletter.
The Blended Rate, FXall PriceStream data and Super RIC.data sets have differing methodologies and sources to accommodate a wide range of use cases and accurately reflect the different market tiers that exist in foreign exchange.
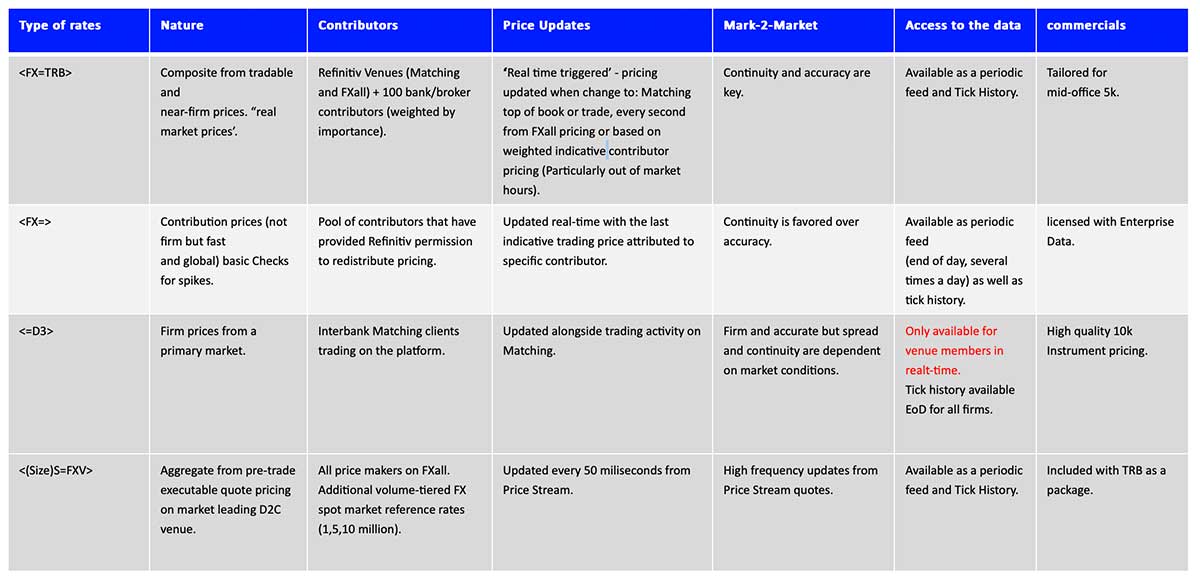
While the Super RIC generally reflects the overall market price with indicative pricing and will serve the needs of most market participants, such as a trader eyeballing the market, the Blended Rate and PriceStream data, with pricing derived from real market activity offers tick-level granularity.
These feeds reflect the most accurate price in the market and react instantly in highly volatile periods.
This will be important as input for client pricing calculation, high-frequency traders and other market participants who are interested in high-frequency price updates both for liquid and illiquid currency pairs.
We have used various metrics, such as mid-price, spreads and realised variance, to compare the data sets and show how each data set reacts to a particular market move.
Given that developed and emerging market currencies may respond differently to economic events, the FX market comparison is done both for developed market currencies, such as EUR and GBP, and emerging markets currencies, such as ZAR and SGD.
This will ensure robustness of comparison differences between TRB and the FXV with the Super RIC during times of high market movement and volatility.
Use cases with developed market currencies
Case with EUR: EUR slides below dollar

Here, we will investigate how this economic event affected the different FX markets for EUR. Because we are dealing here with a highly liquid currency, we will aggregate our tick data in 1-minute intervals and zoom into about +-10 minutes from the actual market movement.
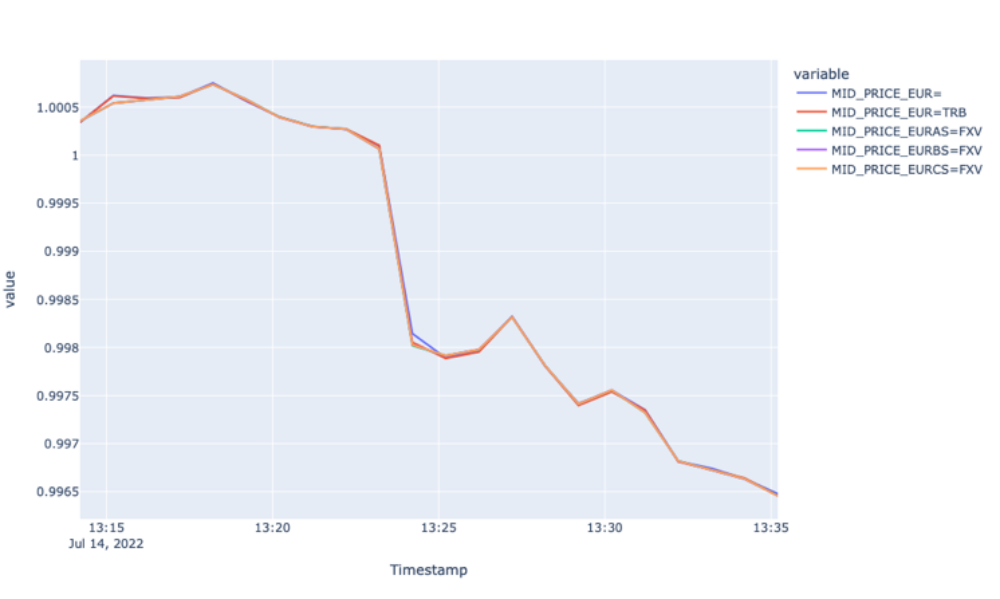

By looking at the line plots above, we observe the highest spread for the Super RIC and the lowest for EURAS
Apart from the difference in the size of the spread, we observe that both TRB and FXV feeds respond better to the market event. In particular, the spreads for those pairs widen during the sudden price change and stabilises afterwards.
However, the spread for the Super RIC remains stale during the observation period.
When it comes to different FXV tiers and TRB, we observe wider spreads as volume tier in FXV increases. EUR=TRB responds to the event by widening the spread at 13:24:12. The spread for the latter is above EURAS=FXV due to the highest spread of EUR=.
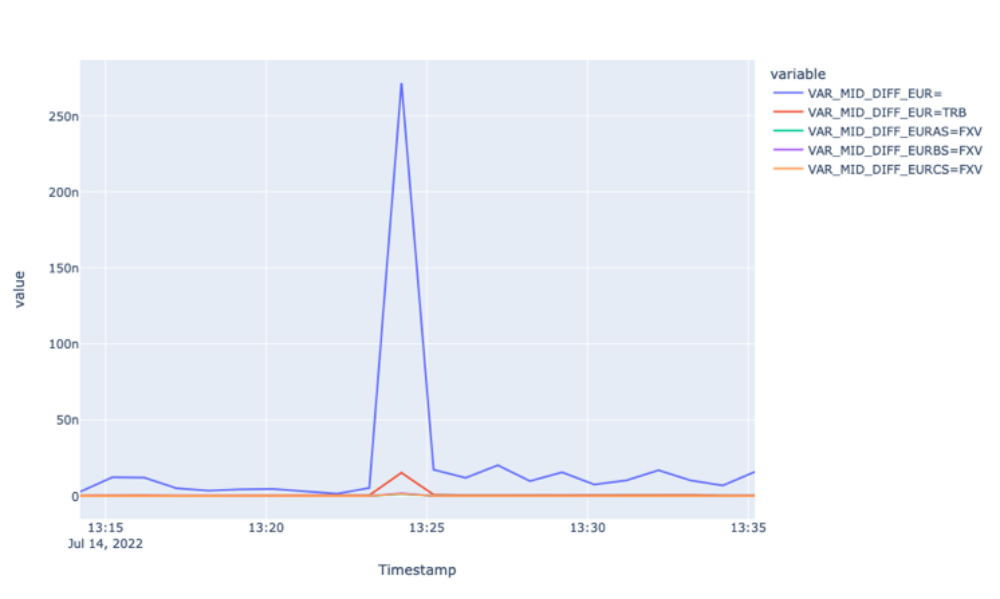
This assertion is further evidenced by looking at the realised variance plot of different FX markets.
The plot below shows how realised variance of mid-price returns for Super RIC and TRY=TRB spike during the economic event, suggesting that the event is reflected after a certain lag.
The plot for mid-price fails to highlight the lagged reflection of new information, again, perhaps, because of aggregation. To see that, let us zoom into the event using tick level prices from about +- 15 seconds from the actual market movement.
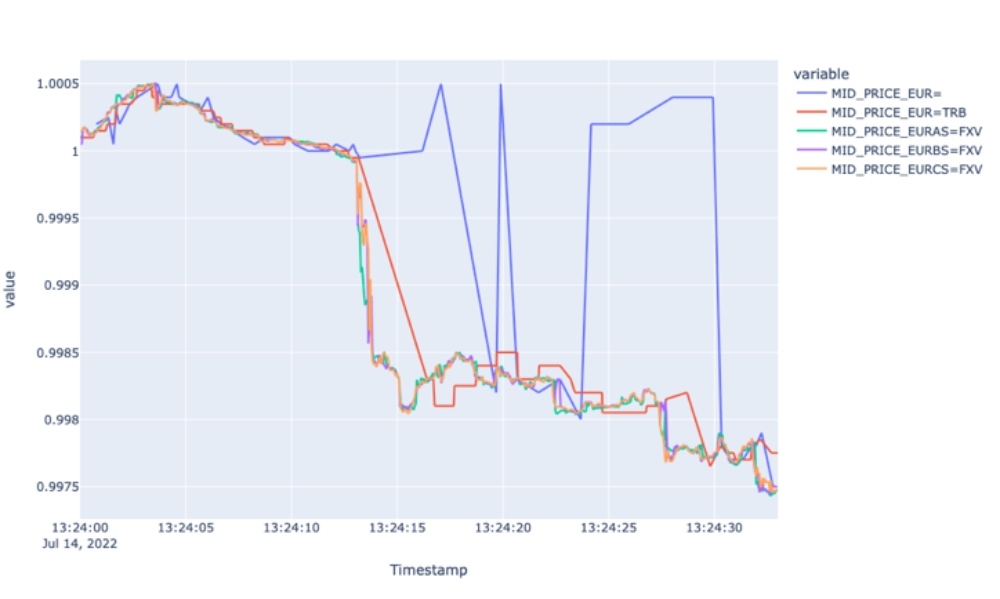
 From looking at the first plot, we can see the fastest response by all FXV feeds and lagged response to the market event by EUR=. In particular, the FXVs had a steep decline at 13:24:14, whereas the Super RIC reflected the new market environment at 13:24:19 only.
Furthermore, the mid-price for the Super RIC carries a lot of noise with many high up and down spikes capturing the actual market condition at 13:24:30.
We also observe a 1-second lagged response by EUR=TRB. However, it could capture the market movement throughout the observation period.
The zoomed plot for the EUR currency pairs spread shows the widening spread for FXVs with large spikes at the beginning of the event, whereas spreads for EUR= remain stale (carrying a lot of noise after the event) throughout the period.
Case with GBP: GBP jumped after lower-than-expected U.S. CPI

For this case we will investigate how the report on U.S. CPI moved the GBP market; in this case upwards compared to the downward move in EUR.
Here again, since we are dealing with a highly liquid currency, we will aggregate our tick data in 1-minute intervals and zoom into the event from about +-10 minutes from the actual market movement.
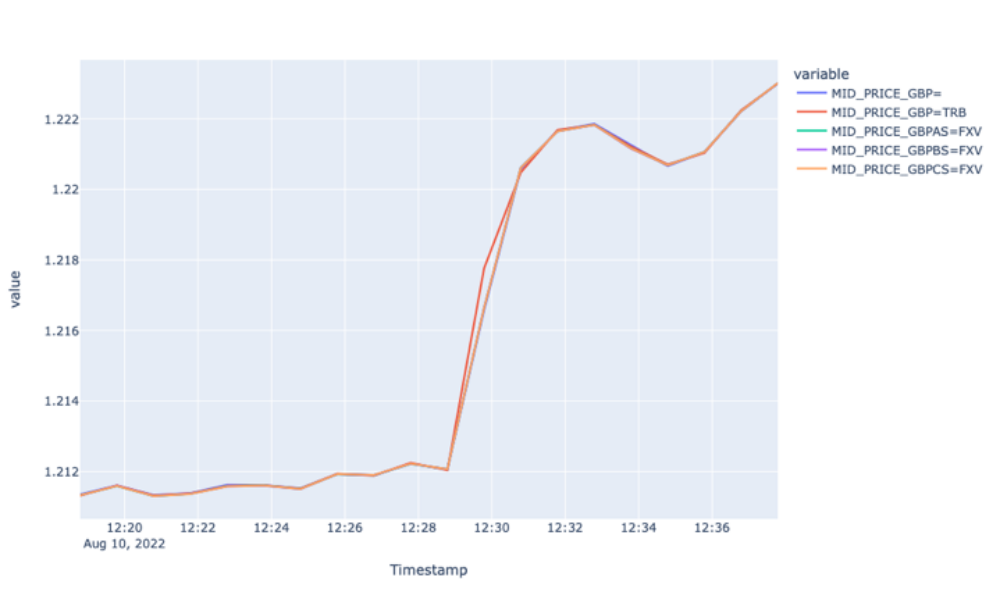
The plots above show a similar picture we had for EUR, with a couple of differences.
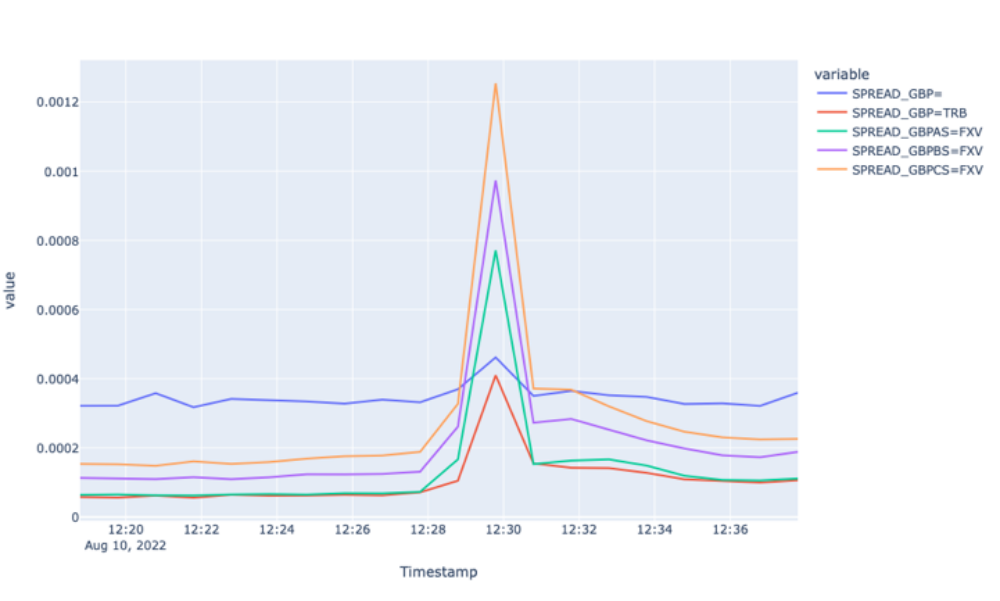
Starting from the similarities, we can observe that all spreads widen at the start of the economic event, the largest volume tier FXV with the widest spreads. The difference with the EUR plot is that the mid-price for the Super RIC for GBP, although weak, responded to the market event.
Additionally, the spread for the Super RIC was lower than the FXVs during the event and bigger before and after.
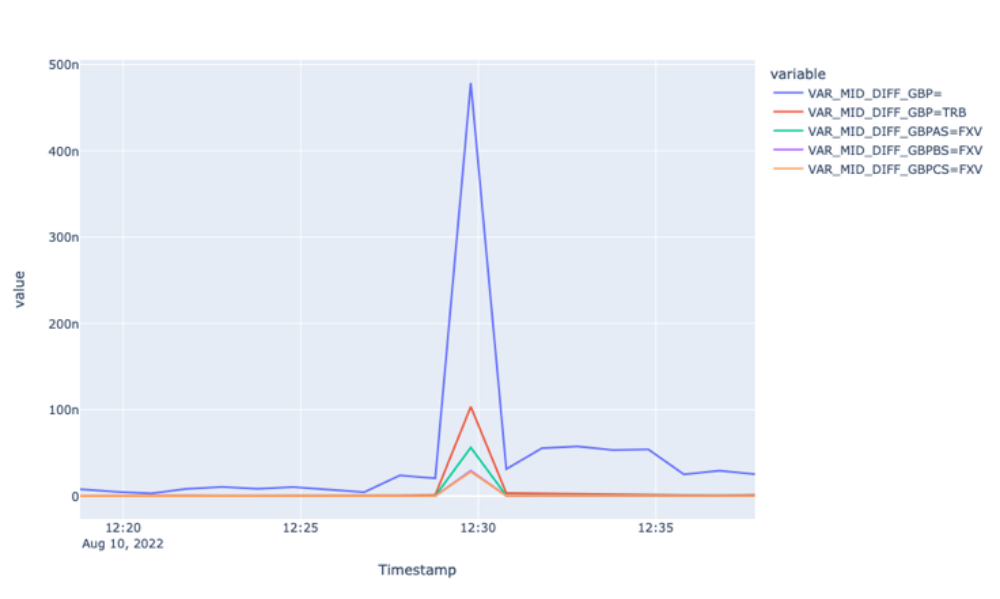
With the realised variances, we experience similar patterns compared to the EUR variances. In particular, we observe the highest realised variance of mid-price returns for the Super RIC and the lowest for GBPCS=FXV.
Overall, for GBP as well, we observe FXVs reflect the market condition best, whereas the Super RIC experiences a lag in reflecting the actual market environment.
Finally, let us zoom into the event using tick level prices from about +- 15 seconds from the actual market movement to explore the potential lagged responses.
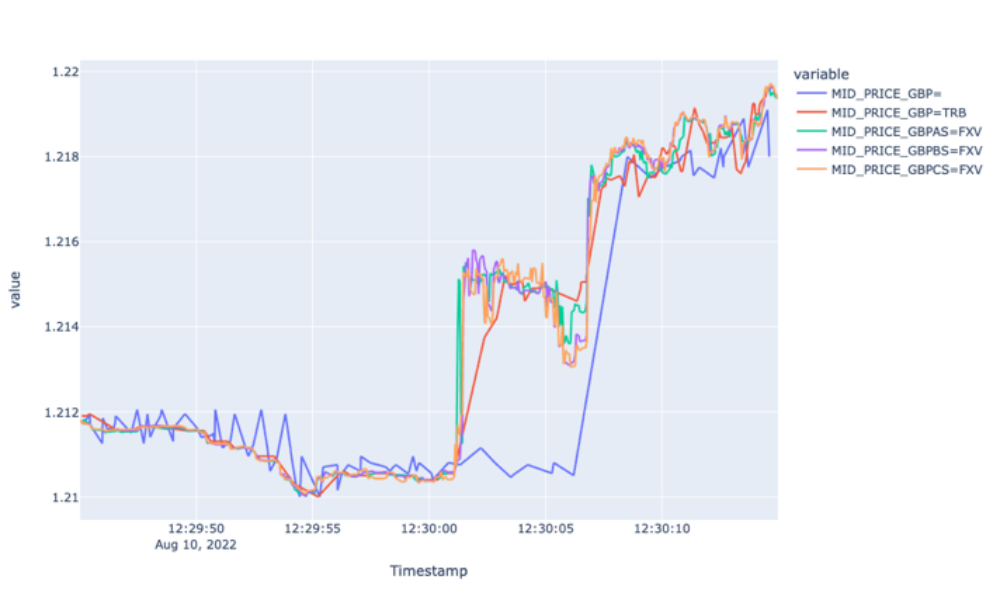
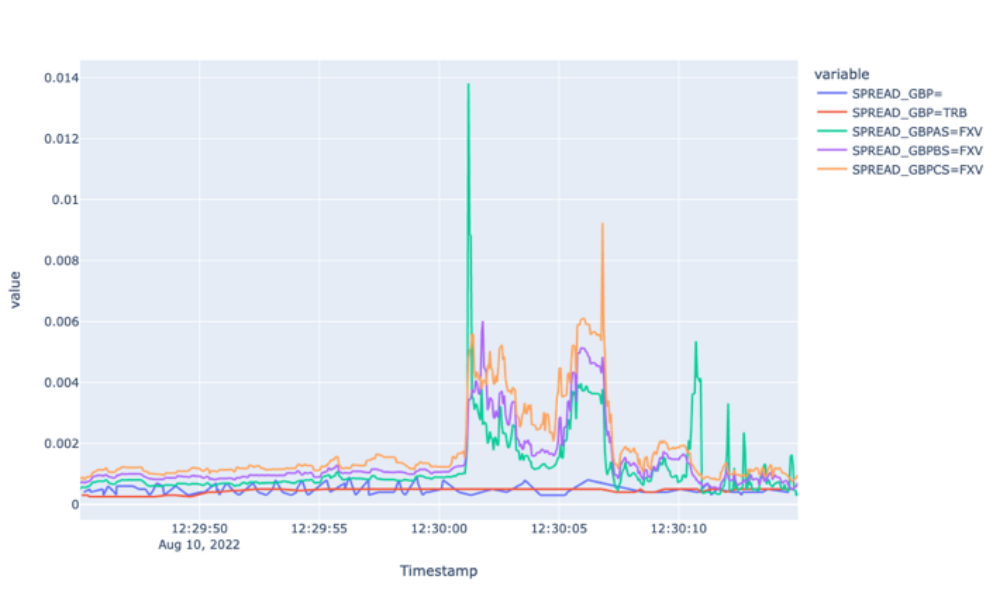
The mid-price plot for GBP markets shows a very similar picture to EUR markets. In particular, we observe 5- and 2-second lagged responses by the Super RIC and GBP=TRB, respectively.
Moreover, the Super RIC missed the market up and correction during 12:30:01 and 12:30:06 and followed the general market trend starting from 12:30:08.
This analysis of the different feeds of developed market currencies leads to the conclusion that FXVs best respond to and reflect the sudden changing market condition.
TRB reflects the market event with a couple of seconds lag, whereas the Super RIC offers much larger lag and sometimes misses the actual market environment during periods of high volatility.
Use cases with emerging markets currency
Case with ZAR: African rand and stocks strengthen as dollar on back foot

In this study, we will delve into the negative move of ZAR and will analyse how different currency market feeds responded to the day’s volatility caused by the news.
First, let us aggregate the tick data in 5-minute intervals to analyse the market movements of different FX markets.
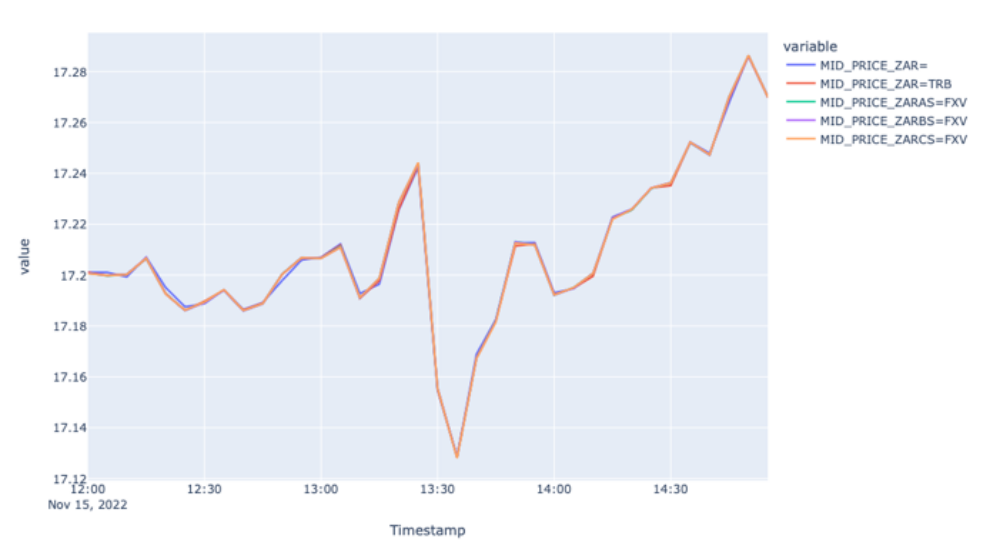
 The first plot showing mid-price movement in different FX markets shows the trendline of the price for 15 November. We observe a negative move at around 13:25 and bounce back after about 10 minutes.
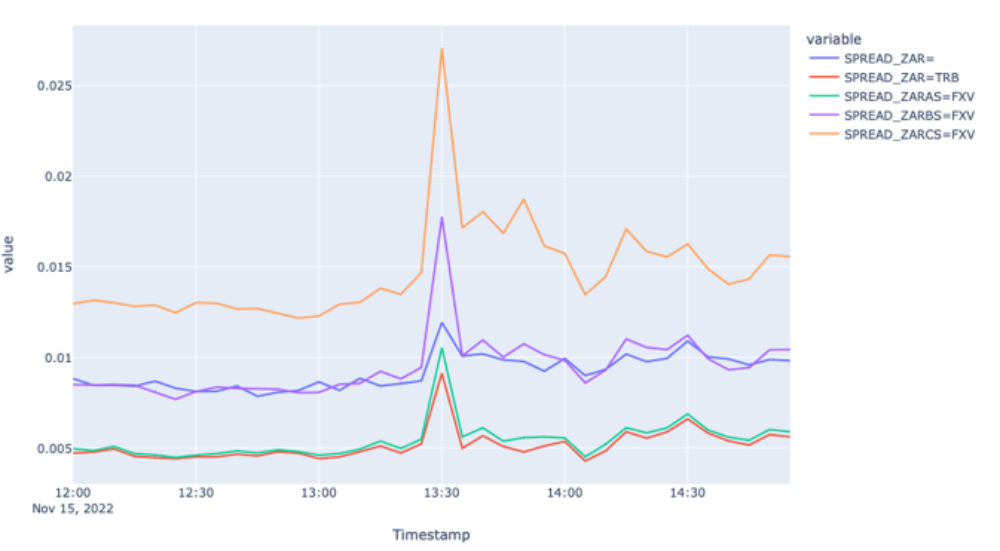
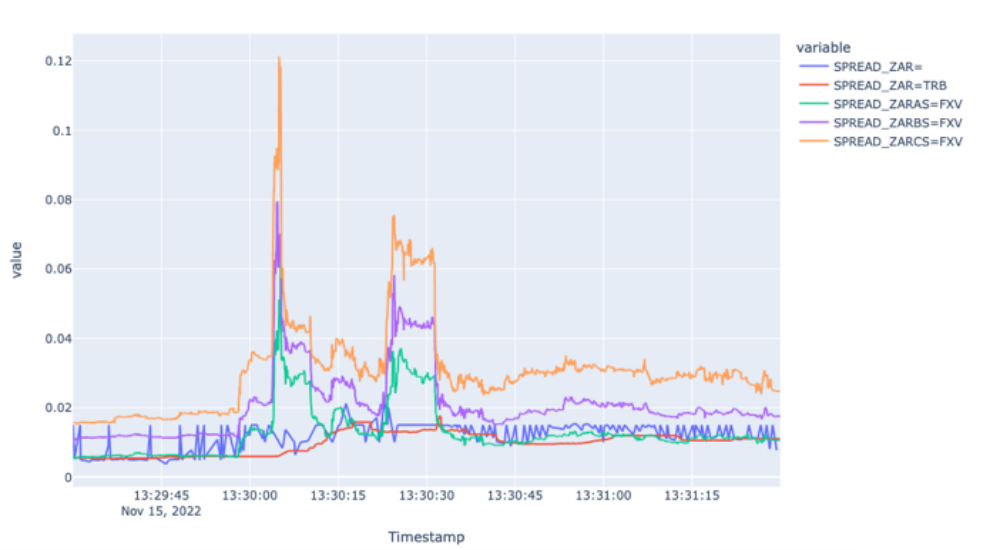
From the spread plots, we see that all the markets responded to the market event by widening the spreads. Moreover, the spreads are wider for FXVBC and FXVCS.
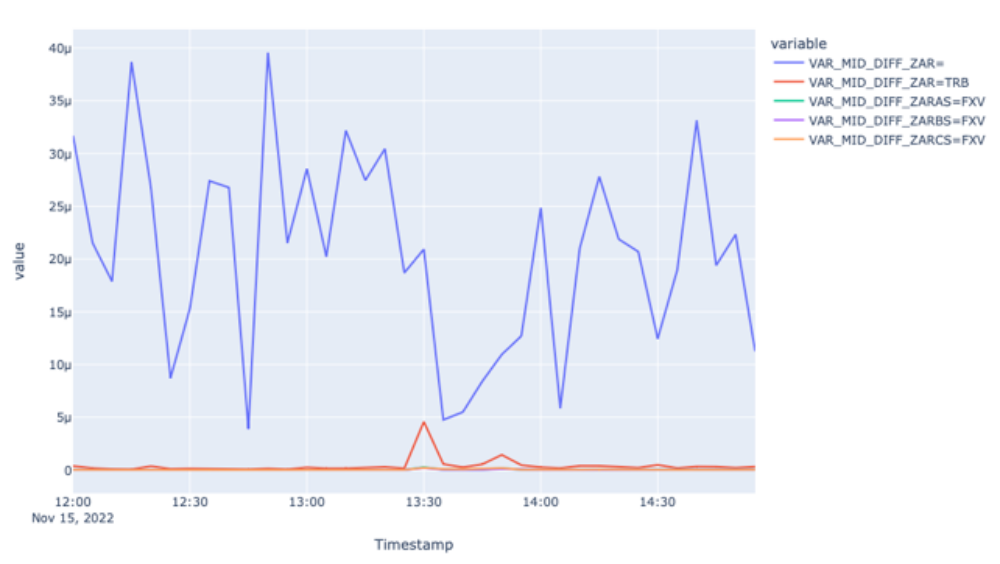
Although the spreads of Super RIC also responded to the market move, the variance plot suggests much higher and unstable variance compared to the rest of the feeds, implying more noise in the Super RIC feed compared to TRB and FXV feeds.
Despite the noise, we could not identify a lag in 5-minute aggregation, so let us now zoom into the event using tick level prices from about +-1 minute from the time the event started to move the market.
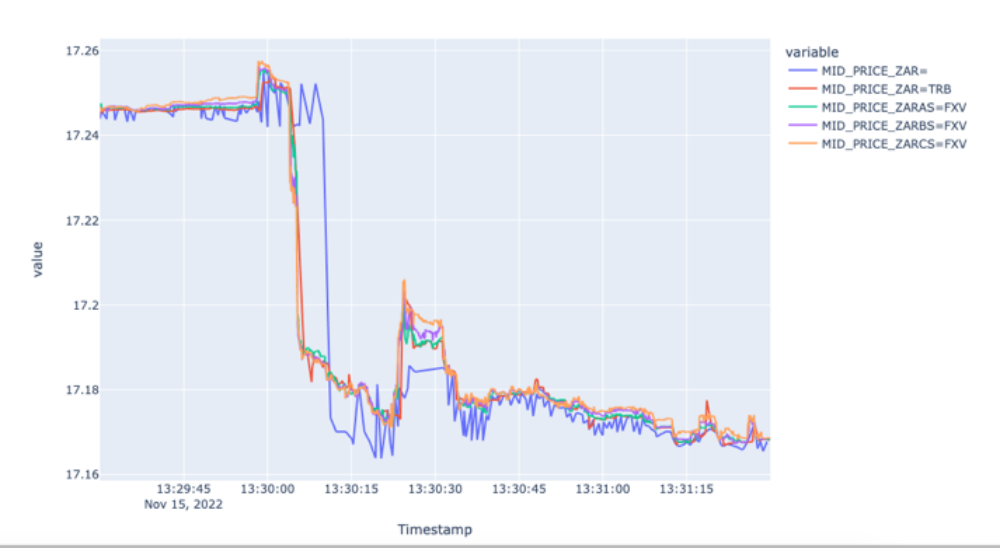
The zoomed-in mid-price data confirm the noise in Super RIC and identifies about a 5-second lag between 13:30:03 and 13:30:08.
The spread plot shows the widening spreads for FXVs during the time of the economic event and stale behaviour from the Super RIC and TRB for the same period. So, here again, the FXV feeds captured the market environment best.
Case with SGD: SGD tepid as investors brace for U.S. inflation
To analyse how different currency market feeds for SGD responded to the day’s volatility caused by the news we, first, aggregate the tick data in 5-minute intervals.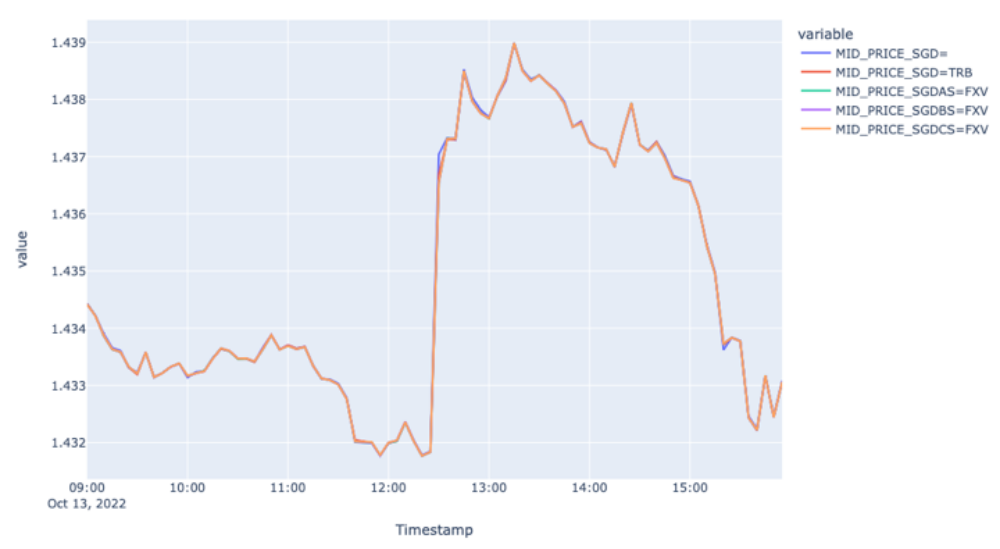
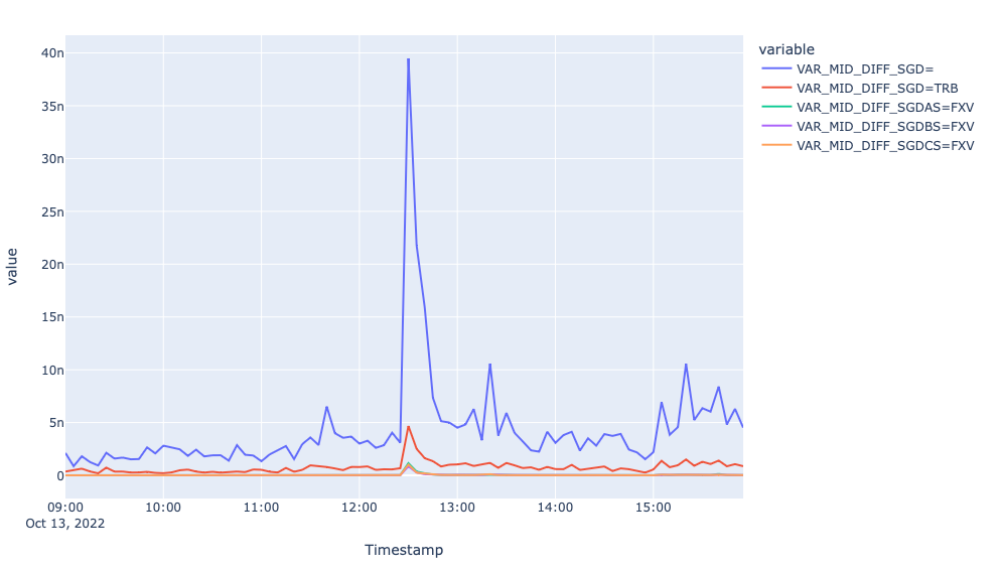
The first plot showing mid-price movement shows the trendline of the price for 13 October.
We observe the impact of the economic event on the prices around 12:28 when the prices increased 0.5 percent during the following 40 minutes and decreased during the rest of the day, overall decreasing 0.1 percent.
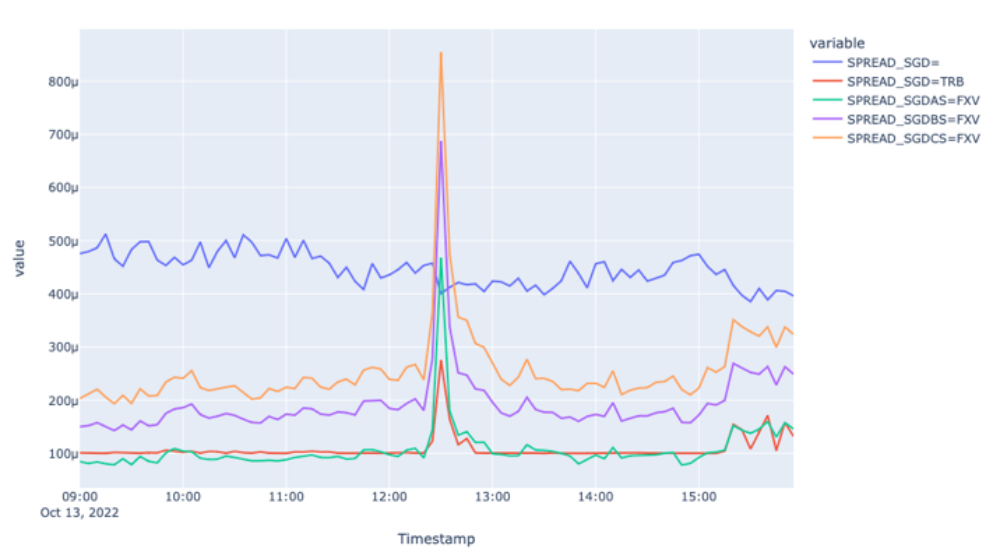
From the spread plots, we see a similar picture to EUR, where FXV and TRB feeds responded to the market event by widening the spreads, whereas the spread for the Super RIC remains stale and responded to the event with a lag.
The latter is well seen in the variance plot, where the realised variance for the Super RIC mid-price spiked about eight times.
To confirm the lagged information response, let’s zoom into the event using tick-level prices as the plot for mid-price above fails to highlight the lagged reflection of new information, perhaps, because of the 5-minute aggregation.

From the mid-price plot, we can observe that Super RIC misses more than 400 ticks during the 20 seconds between 12:30:05 and 12:30:25, where the rest of the markets experience several ups and downs.
The granularity offered here by FXV and TRB feeds can be of immense value to the high-frequency traders and other market participants interested in the fastest possible market price updates.
It is worth also highlighting, that although the TRB copes with the market, it offers a little bit of noise and latency compared to the FXVs.
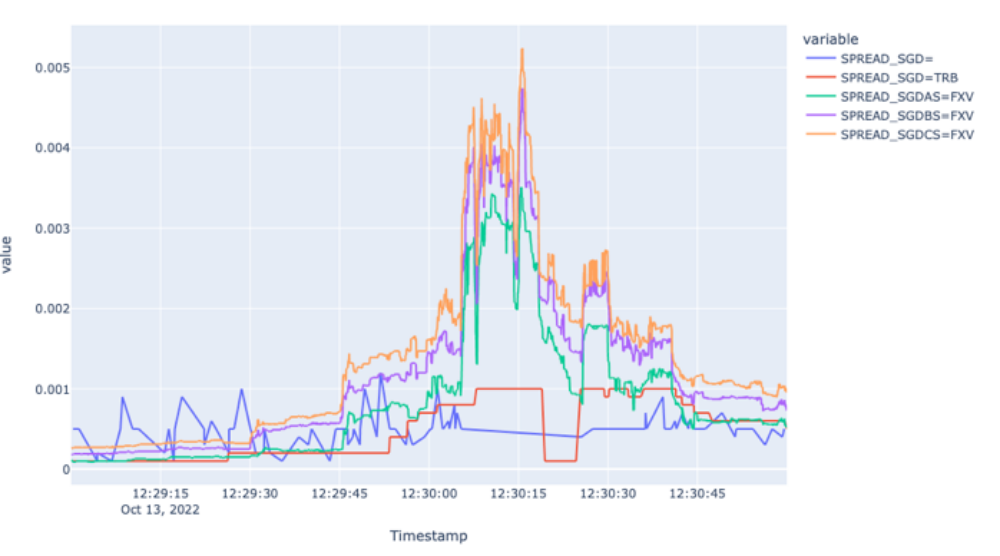
The zoomed-in plot for the spreads shows the widening spreads for FXVs during the time of the economic event.
Additionally, we can observe stale behaviour from the Super RIC and TRB.
The latter is perhaps because TRB is mixed from FXVAS and the Super RIC itself; the latency of which during highly volatile periods impacts the overall behaviour of the TRB as well.
It is worth mentioning that the lagging would be more acute in credit-constraint currencies, such as TRY. This is driven by local banks intervening in the currency markets.
As those local banks do not have credit with all Western banks, we see a lag in price; as it takes time to disseminate the information.
Which FX feed is best for you?
In this study, we tested the reactions of developed and emerging market currencies to economic events to see which FX feed source performed best both across longer timeframes and using zoomed-in/tick data for very small timeframes.
In summary, we have shown that the Super RICs, formed from indicative prices, perform reasonably during normal market modes, accurately reflecting actual market conditions and introducing small lags in high volatile periods.
Overall, the Super RIC, despite some lag and noise, will serve the needs of most of the market participants eyeballing the market.
However, high-frequency traders and other market participants who are interested in high-frequency price updates will benefit more from FXV and TRB market feeds.
These feeds are derived from real market activity and offer tick-level granularity permitting the reflection of actual market conditions in the best possible way.